Finnish vs Ute Disability Age 5 to 17
COMPARE
Finnish
Ute
Disability Age 5 to 17
Disability Age 5 to 17 Comparison
Finns
Ute
6.0%
DISABILITY AGE 5 TO 17
0.2/ 100
METRIC RATING
272nd/ 347
METRIC RANK
5.5%
DISABILITY AGE 5 TO 17
80.6/ 100
METRIC RATING
152nd/ 347
METRIC RANK
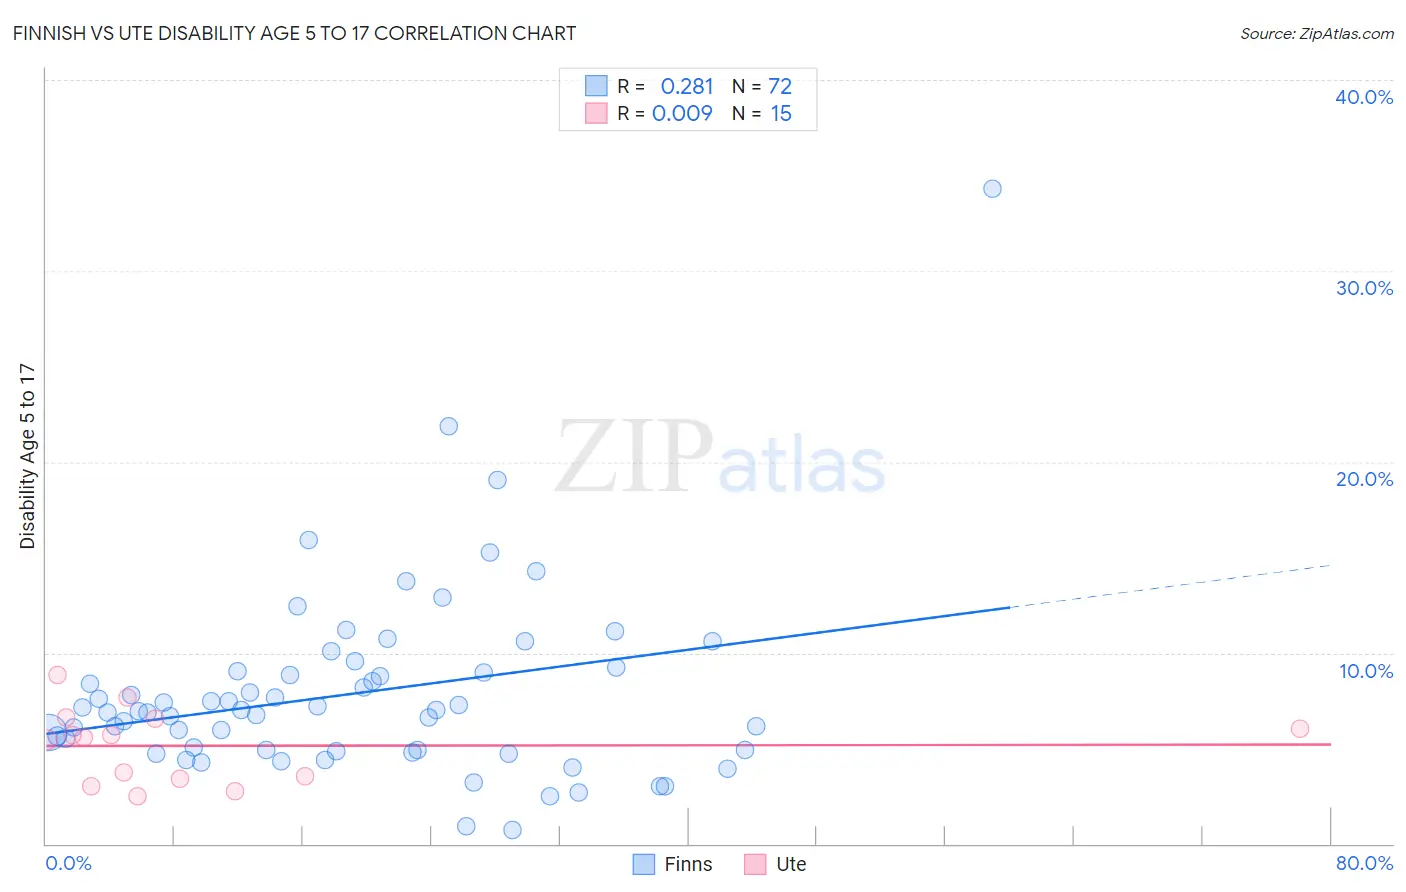
Finnish vs Ute Disability Age 5 to 17 Correlation Chart
The statistical analysis conducted on geographies consisting of 400,280,382 people shows a weak positive correlation between the proportion of Finns and percentage of population with a disability between the ages 5 and 17 in the United States with a correlation coefficient (R) of 0.281 and weighted average of 6.0%. Similarly, the statistical analysis conducted on geographies consisting of 55,569,017 people shows no correlation between the proportion of Ute and percentage of population with a disability between the ages 5 and 17 in the United States with a correlation coefficient (R) of 0.009 and weighted average of 5.5%, a difference of 9.6%.
Disability Age 5 to 17 Correlation Summary
| Measurement | Finnish | Ute |
| Minimum | 0.71% | 2.5% |
| Maximum | 34.3% | 8.8% |
| Range | 33.6% | 6.3% |
| Mean | 7.9% | 5.1% |
| Median | 7.0% | 5.6% |
| Interquartile 25% (IQ1) | 4.9% | 3.4% |
| Interquartile 75% (IQ3) | 9.0% | 6.5% |
| Interquartile Range (IQR) | 4.1% | 3.1% |
| Standard Deviation (Sample) | 5.0% | 1.9% |
| Standard Deviation (Population) | 4.9% | 1.8% |
Similar Demographics by Disability Age 5 to 17
Demographics Similar to Finns by Disability Age 5 to 17
In terms of disability age 5 to 17, the demographic groups most similar to Finns are Immigrants from Zaire (6.0%, a difference of 0.030%), Alaska Native (6.0%, a difference of 0.050%), Cheyenne (6.0%, a difference of 0.16%), Dutch (6.0%, a difference of 0.27%), and Japanese (6.1%, a difference of 0.38%).
| Demographics | Rating | Rank | Disability Age 5 to 17 |
| Panamanians | 0.6 /100 | #265 | Tragic 6.0% |
| Slovenes | 0.6 /100 | #266 | Tragic 6.0% |
| Spanish | 0.5 /100 | #267 | Tragic 6.0% |
| Sioux | 0.4 /100 | #268 | Tragic 6.0% |
| Liberians | 0.4 /100 | #269 | Tragic 6.0% |
| Immigrants | Somalia | 0.4 /100 | #270 | Tragic 6.0% |
| Immigrants | Zaire | 0.2 /100 | #271 | Tragic 6.0% |
| Finns | 0.2 /100 | #272 | Tragic 6.0% |
| Alaska Natives | 0.2 /100 | #273 | Tragic 6.0% |
| Cheyenne | 0.2 /100 | #274 | Tragic 6.0% |
| Dutch | 0.2 /100 | #275 | Tragic 6.0% |
| Japanese | 0.1 /100 | #276 | Tragic 6.1% |
| Puget Sound Salish | 0.1 /100 | #277 | Tragic 6.1% |
| Immigrants | Liberia | 0.1 /100 | #278 | Tragic 6.1% |
| Immigrants | Jamaica | 0.1 /100 | #279 | Tragic 6.1% |
Demographics Similar to Ute by Disability Age 5 to 17
In terms of disability age 5 to 17, the demographic groups most similar to Ute are Estonian (5.5%, a difference of 0.010%), Guatemalan (5.5%, a difference of 0.070%), Ecuadorian (5.5%, a difference of 0.070%), Central American (5.5%, a difference of 0.080%), and Samoan (5.5%, a difference of 0.11%).
| Demographics | Rating | Rank | Disability Age 5 to 17 |
| Immigrants | Guatemala | 86.6 /100 | #145 | Excellent 5.5% |
| Albanians | 83.7 /100 | #146 | Excellent 5.5% |
| Immigrants | Albania | 83.1 /100 | #147 | Excellent 5.5% |
| Samoans | 81.9 /100 | #148 | Excellent 5.5% |
| Central Americans | 81.6 /100 | #149 | Excellent 5.5% |
| Guatemalans | 81.5 /100 | #150 | Excellent 5.5% |
| Estonians | 80.8 /100 | #151 | Excellent 5.5% |
| Ute | 80.6 /100 | #152 | Excellent 5.5% |
| Ecuadorians | 79.7 /100 | #153 | Good 5.5% |
| Australians | 78.8 /100 | #154 | Good 5.5% |
| Immigrants | Ecuador | 78.3 /100 | #155 | Good 5.5% |
| Hawaiians | 78.0 /100 | #156 | Good 5.5% |
| Immigrants | Costa Rica | 77.9 /100 | #157 | Good 5.5% |
| Immigrants | Nepal | 77.1 /100 | #158 | Good 5.5% |
| Immigrants | Zimbabwe | 75.3 /100 | #159 | Good 5.5% |