Finnish vs Immigrants from Greece No Schooling Completed
COMPARE
Finnish
Immigrants from Greece
No Schooling Completed
No Schooling Completed Comparison
Finns
Immigrants from Greece
1.5%
NO SCHOOLING COMPLETED
100.0/ 100
METRIC RATING
16th/ 347
METRIC RANK
2.0%
NO SCHOOLING COMPLETED
83.5/ 100
METRIC RATING
141st/ 347
METRIC RANK
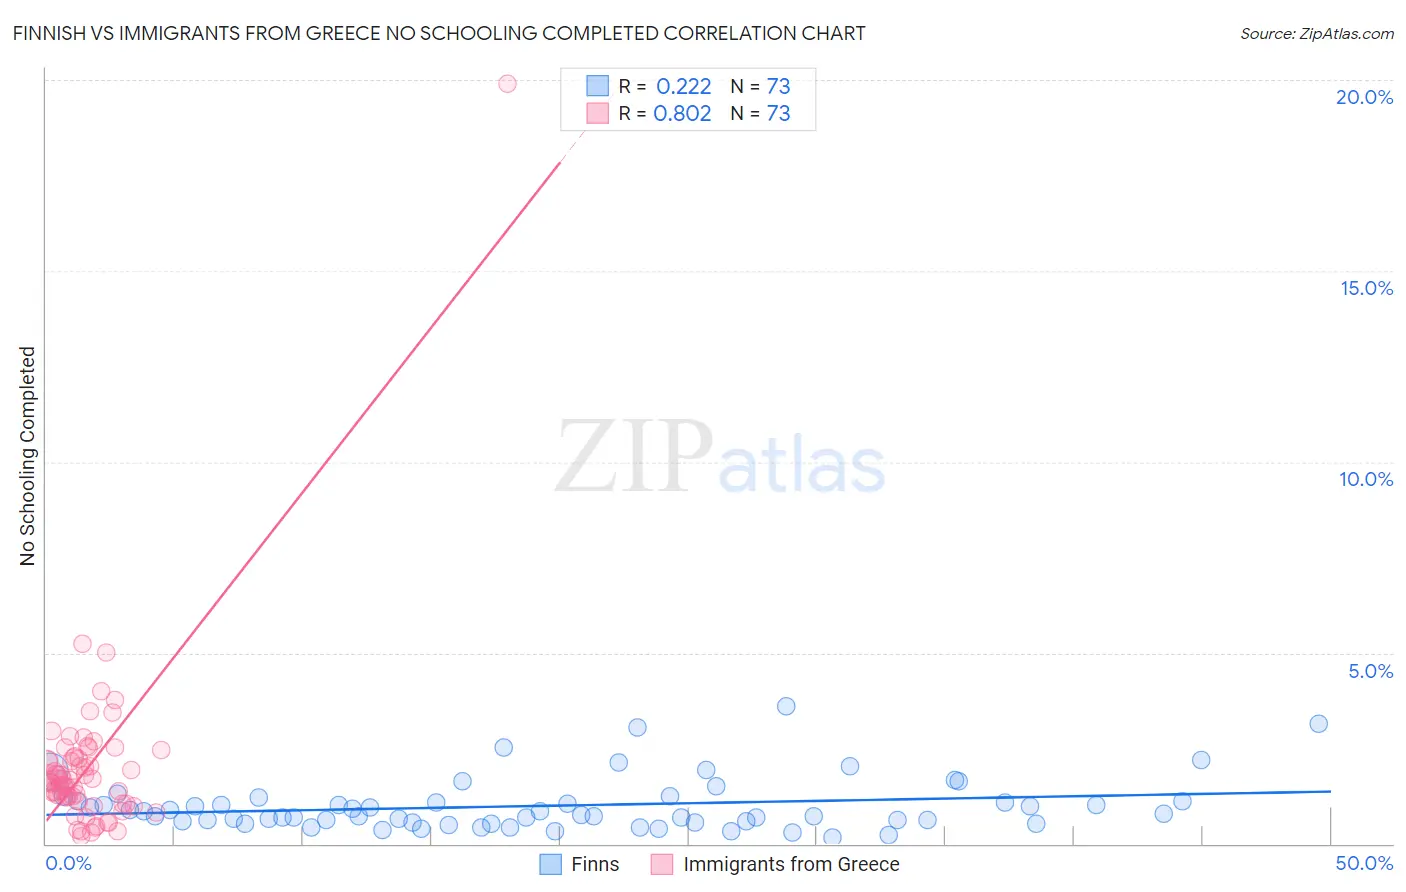
Finnish vs Immigrants from Greece No Schooling Completed Correlation Chart
The statistical analysis conducted on geographies consisting of 398,073,835 people shows a weak positive correlation between the proportion of Finns and percentage of population with no schooling in the United States with a correlation coefficient (R) of 0.222 and weighted average of 1.5%. Similarly, the statistical analysis conducted on geographies consisting of 215,786,683 people shows a very strong positive correlation between the proportion of Immigrants from Greece and percentage of population with no schooling in the United States with a correlation coefficient (R) of 0.802 and weighted average of 2.0%, a difference of 35.5%.
No Schooling Completed Correlation Summary
| Measurement | Finnish | Immigrants from Greece |
| Minimum | 0.18% | 0.20% |
| Maximum | 3.6% | 19.9% |
| Range | 3.4% | 19.7% |
| Mean | 0.99% | 2.0% |
| Median | 0.75% | 1.6% |
| Interquartile 25% (IQ1) | 0.58% | 1.2% |
| Interquartile 75% (IQ3) | 1.1% | 2.2% |
| Interquartile Range (IQR) | 0.53% | 1.1% |
| Standard Deviation (Sample) | 0.68% | 2.3% |
| Standard Deviation (Population) | 0.68% | 2.3% |
Similar Demographics by No Schooling Completed
Demographics Similar to Finns by No Schooling Completed
In terms of no schooling completed, the demographic groups most similar to Finns are Croatian (1.5%, a difference of 0.010%), Danish (1.5%, a difference of 0.31%), Alaskan Athabascan (1.5%, a difference of 0.42%), Tlingit-Haida (1.5%, a difference of 0.52%), and Welsh (1.5%, a difference of 0.54%).
| Demographics | Rating | Rank | No Schooling Completed |
| Scottish | 100.0 /100 | #9 | Exceptional 1.4% |
| Dutch | 100.0 /100 | #10 | Exceptional 1.4% |
| Lithuanians | 100.0 /100 | #11 | Exceptional 1.4% |
| Irish | 100.0 /100 | #12 | Exceptional 1.4% |
| Poles | 100.0 /100 | #13 | Exceptional 1.4% |
| Scotch-Irish | 100.0 /100 | #14 | Exceptional 1.5% |
| Tlingit-Haida | 100.0 /100 | #15 | Exceptional 1.5% |
| Finns | 100.0 /100 | #16 | Exceptional 1.5% |
| Croatians | 100.0 /100 | #17 | Exceptional 1.5% |
| Danes | 100.0 /100 | #18 | Exceptional 1.5% |
| Alaskan Athabascans | 100.0 /100 | #19 | Exceptional 1.5% |
| Welsh | 100.0 /100 | #20 | Exceptional 1.5% |
| Chinese | 100.0 /100 | #21 | Exceptional 1.5% |
| Alaska Natives | 100.0 /100 | #22 | Exceptional 1.5% |
| Europeans | 100.0 /100 | #23 | Exceptional 1.5% |
Demographics Similar to Immigrants from Greece by No Schooling Completed
In terms of no schooling completed, the demographic groups most similar to Immigrants from Greece are Marshallese (2.0%, a difference of 0.010%), Jordanian (2.0%, a difference of 0.27%), Venezuelan (2.0%, a difference of 0.49%), Immigrants from Israel (2.0%, a difference of 0.52%), and Filipino (2.0%, a difference of 0.56%).
| Demographics | Rating | Rank | No Schooling Completed |
| Menominee | 89.6 /100 | #134 | Excellent 1.9% |
| Hmong | 88.5 /100 | #135 | Excellent 1.9% |
| Burmese | 88.2 /100 | #136 | Excellent 1.9% |
| Filipinos | 85.5 /100 | #137 | Excellent 2.0% |
| Immigrants | Israel | 85.4 /100 | #138 | Excellent 2.0% |
| Jordanians | 84.5 /100 | #139 | Excellent 2.0% |
| Marshallese | 83.5 /100 | #140 | Excellent 2.0% |
| Immigrants | Greece | 83.5 /100 | #141 | Excellent 2.0% |
| Venezuelans | 81.5 /100 | #142 | Excellent 2.0% |
| Immigrants | South Central Asia | 80.0 /100 | #143 | Good 2.0% |
| Alsatians | 79.1 /100 | #144 | Good 2.0% |
| Immigrants | Iran | 79.0 /100 | #145 | Good 2.0% |
| Immigrants | Moldova | 78.0 /100 | #146 | Good 2.0% |
| Soviet Union | 77.1 /100 | #147 | Good 2.0% |
| Shoshone | 76.7 /100 | #148 | Good 2.0% |