Tongan vs Immigrants from Greece Disability Age Under 5
COMPARE
Tongan
Immigrants from Greece
Disability Age Under 5
Disability Age Under 5 Comparison
Tongans
Immigrants from Greece
1.3%
DISABILITY AGE UNDER 5
4.2/ 100
METRIC RATING
233rd/ 347
METRIC RANK
1.3%
DISABILITY AGE UNDER 5
19.1/ 100
METRIC RATING
211th/ 347
METRIC RANK
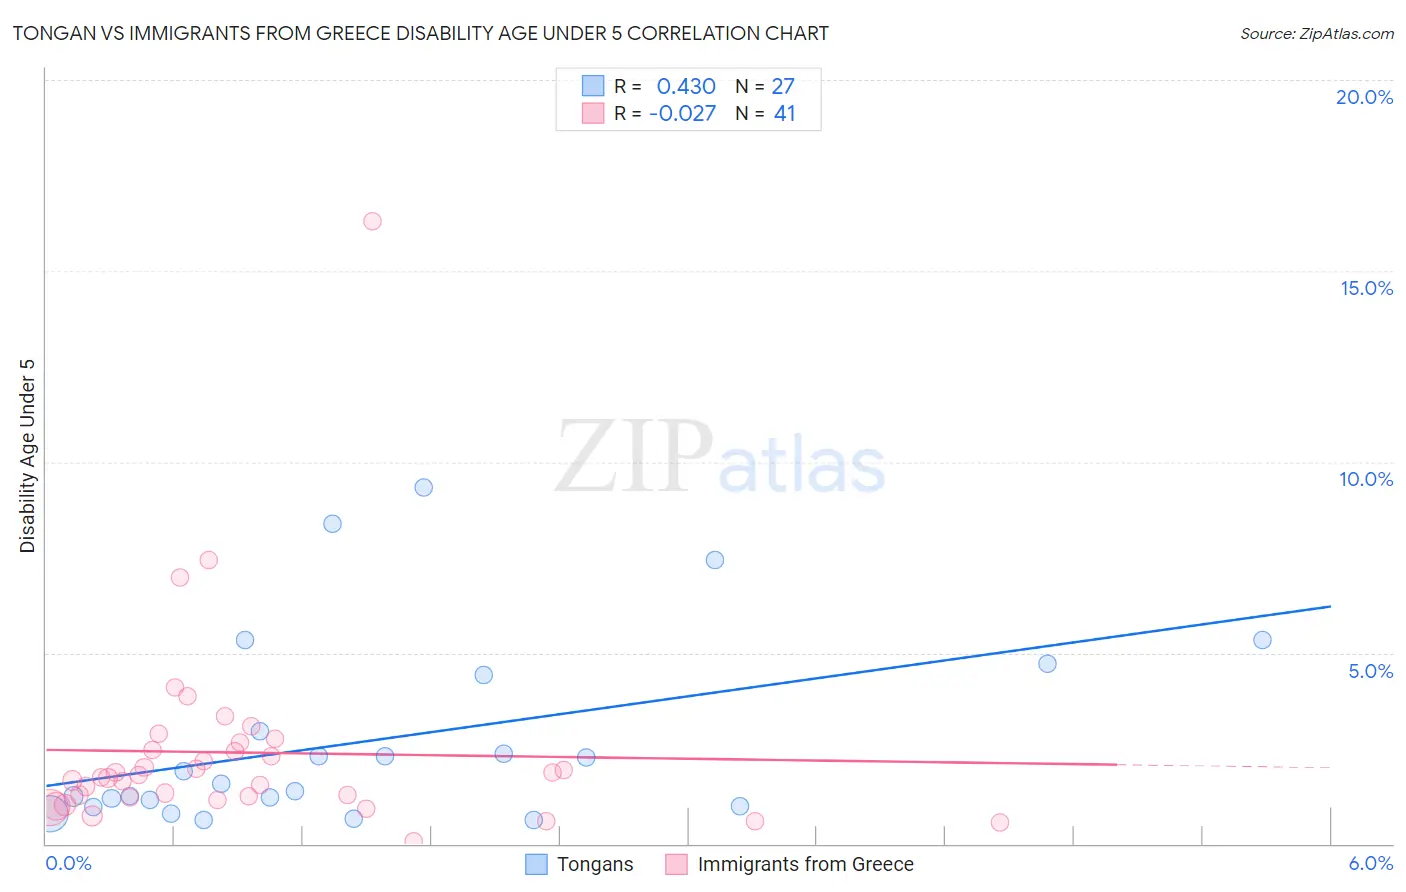
Tongan vs Immigrants from Greece Disability Age Under 5 Correlation Chart
The statistical analysis conducted on geographies consisting of 77,388,700 people shows a moderate positive correlation between the proportion of Tongans and percentage of population with a disability under the age of 5 in the United States with a correlation coefficient (R) of 0.430 and weighted average of 1.3%. Similarly, the statistical analysis conducted on geographies consisting of 132,613,079 people shows no correlation between the proportion of Immigrants from Greece and percentage of population with a disability under the age of 5 in the United States with a correlation coefficient (R) of -0.027 and weighted average of 1.3%, a difference of 3.7%.
Disability Age Under 5 Correlation Summary
| Measurement | Tongan | Immigrants from Greece |
| Minimum | 0.61% | 0.058% |
| Maximum | 9.3% | 16.3% |
| Range | 8.7% | 16.2% |
| Mean | 2.7% | 2.4% |
| Median | 1.6% | 1.7% |
| Interquartile 25% (IQ1) | 0.97% | 1.2% |
| Interquartile 75% (IQ3) | 4.4% | 2.6% |
| Interquartile Range (IQR) | 3.4% | 1.4% |
| Standard Deviation (Sample) | 2.5% | 2.7% |
| Standard Deviation (Population) | 2.4% | 2.6% |
Similar Demographics by Disability Age Under 5
Demographics Similar to Tongans by Disability Age Under 5
In terms of disability age under 5, the demographic groups most similar to Tongans are French American Indian (1.3%, a difference of 0.12%), Immigrants from Northern Europe (1.3%, a difference of 0.25%), Pueblo (1.3%, a difference of 0.26%), Central American Indian (1.3%, a difference of 0.33%), and Lebanese (1.3%, a difference of 0.49%).
| Demographics | Rating | Rank | Disability Age Under 5 |
| Bahamians | 7.1 /100 | #226 | Tragic 1.3% |
| Taiwanese | 6.1 /100 | #227 | Tragic 1.3% |
| Luxembourgers | 6.1 /100 | #228 | Tragic 1.3% |
| Immigrants | Costa Rica | 5.5 /100 | #229 | Tragic 1.3% |
| Lebanese | 5.3 /100 | #230 | Tragic 1.3% |
| Immigrants | Northern Europe | 4.7 /100 | #231 | Tragic 1.3% |
| French American Indians | 4.5 /100 | #232 | Tragic 1.3% |
| Tongans | 4.2 /100 | #233 | Tragic 1.3% |
| Pueblo | 3.8 /100 | #234 | Tragic 1.3% |
| Central American Indians | 3.6 /100 | #235 | Tragic 1.3% |
| South American Indians | 3.3 /100 | #236 | Tragic 1.3% |
| Basques | 3.0 /100 | #237 | Tragic 1.3% |
| Spanish American Indians | 2.4 /100 | #238 | Tragic 1.3% |
| Immigrants | Austria | 2.3 /100 | #239 | Tragic 1.3% |
| Native Hawaiians | 2.2 /100 | #240 | Tragic 1.3% |
Demographics Similar to Immigrants from Greece by Disability Age Under 5
In terms of disability age under 5, the demographic groups most similar to Immigrants from Greece are Pakistani (1.3%, a difference of 0.040%), Chilean (1.3%, a difference of 0.040%), Bulgarian (1.3%, a difference of 0.050%), Immigrants from Sudan (1.3%, a difference of 0.060%), and Mexican (1.3%, a difference of 0.23%).
| Demographics | Rating | Rank | Disability Age Under 5 |
| Immigrants | Europe | 23.6 /100 | #204 | Fair 1.3% |
| Romanians | 22.5 /100 | #205 | Fair 1.3% |
| Immigrants | Poland | 22.4 /100 | #206 | Fair 1.3% |
| Nigerians | 21.2 /100 | #207 | Fair 1.3% |
| Mexicans | 20.8 /100 | #208 | Fair 1.3% |
| Bulgarians | 19.5 /100 | #209 | Poor 1.3% |
| Pakistanis | 19.4 /100 | #210 | Poor 1.3% |
| Immigrants | Greece | 19.1 /100 | #211 | Poor 1.3% |
| Chileans | 18.8 /100 | #212 | Poor 1.3% |
| Immigrants | Sudan | 18.7 /100 | #213 | Poor 1.3% |
| Immigrants | Chile | 17.2 /100 | #214 | Poor 1.3% |
| Syrians | 16.1 /100 | #215 | Poor 1.3% |
| Bangladeshis | 15.5 /100 | #216 | Poor 1.3% |
| Cypriots | 14.9 /100 | #217 | Poor 1.3% |
| Malaysians | 13.2 /100 | #218 | Poor 1.3% |