Finnish vs Albanian Hearing Disability
COMPARE
Finnish
Albanian
Hearing Disability
Hearing Disability Comparison
Finns
Albanians
3.7%
HEARING DISABILITY
0.0/ 100
METRIC RATING
291st/ 347
METRIC RANK
2.9%
HEARING DISABILITY
66.6/ 100
METRIC RATING
161st/ 347
METRIC RANK
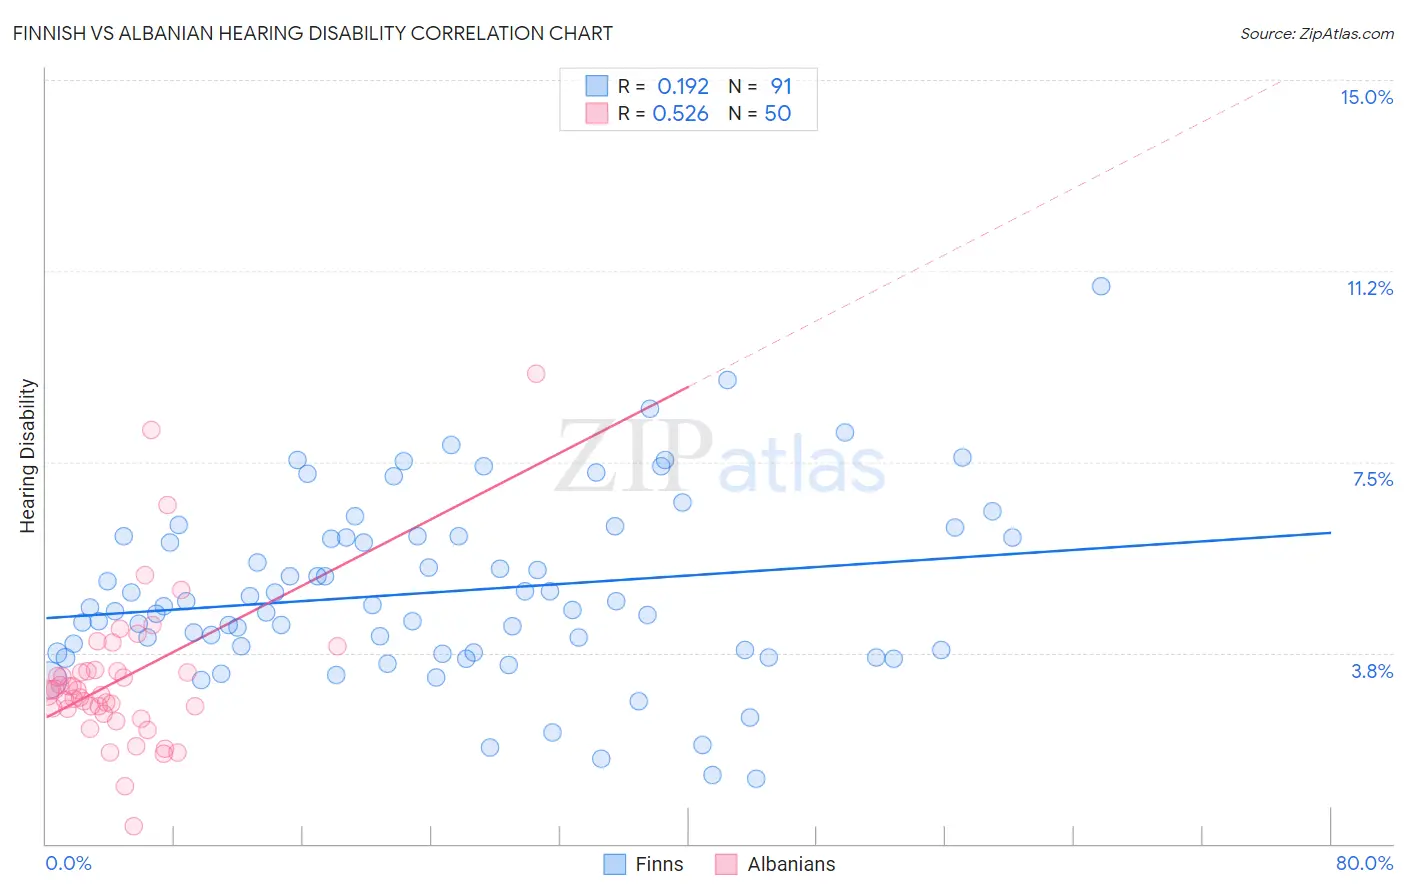
Finnish vs Albanian Hearing Disability Correlation Chart
The statistical analysis conducted on geographies consisting of 404,503,893 people shows a poor positive correlation between the proportion of Finns and percentage of population with hearing disability in the United States with a correlation coefficient (R) of 0.192 and weighted average of 3.7%. Similarly, the statistical analysis conducted on geographies consisting of 193,249,073 people shows a substantial positive correlation between the proportion of Albanians and percentage of population with hearing disability in the United States with a correlation coefficient (R) of 0.526 and weighted average of 2.9%, a difference of 25.1%.
Hearing Disability Correlation Summary
| Measurement | Finnish | Albanian |
| Minimum | 1.3% | 0.33% |
| Maximum | 10.9% | 9.2% |
| Range | 9.7% | 8.9% |
| Mean | 4.9% | 3.3% |
| Median | 4.6% | 3.0% |
| Interquartile 25% (IQ1) | 3.8% | 2.6% |
| Interquartile 75% (IQ3) | 6.0% | 3.4% |
| Interquartile Range (IQR) | 2.3% | 0.75% |
| Standard Deviation (Sample) | 1.8% | 1.5% |
| Standard Deviation (Population) | 1.8% | 1.5% |
Similar Demographics by Hearing Disability
Demographics Similar to Finns by Hearing Disability
In terms of hearing disability, the demographic groups most similar to Finns are White/Caucasian (3.7%, a difference of 0.010%), Native Hawaiian (3.7%, a difference of 0.060%), Norwegian (3.7%, a difference of 0.12%), Chinese (3.7%, a difference of 0.15%), and Irish (3.7%, a difference of 0.35%).
| Demographics | Rating | Rank | Hearing Disability |
| Immigrants | Micronesia | 0.0 /100 | #284 | Tragic 3.6% |
| Sioux | 0.0 /100 | #285 | Tragic 3.6% |
| Delaware | 0.0 /100 | #286 | Tragic 3.6% |
| Spanish | 0.0 /100 | #287 | Tragic 3.7% |
| Irish | 0.0 /100 | #288 | Tragic 3.7% |
| Chinese | 0.0 /100 | #289 | Tragic 3.7% |
| Whites/Caucasians | 0.0 /100 | #290 | Tragic 3.7% |
| Finns | 0.0 /100 | #291 | Tragic 3.7% |
| Native Hawaiians | 0.0 /100 | #292 | Tragic 3.7% |
| Norwegians | 0.0 /100 | #293 | Tragic 3.7% |
| Iroquois | 0.0 /100 | #294 | Tragic 3.7% |
| Welsh | 0.0 /100 | #295 | Tragic 3.7% |
| Pima | 0.0 /100 | #296 | Tragic 3.7% |
| Immigrants | Azores | 0.0 /100 | #297 | Tragic 3.7% |
| Celtics | 0.0 /100 | #298 | Tragic 3.7% |
Demographics Similar to Albanians by Hearing Disability
In terms of hearing disability, the demographic groups most similar to Albanians are Immigrants from Japan (2.9%, a difference of 0.030%), Immigrants from Fiji (2.9%, a difference of 0.060%), Immigrants from Australia (2.9%, a difference of 0.090%), Immigrants from Central America (3.0%, a difference of 0.17%), and Immigrants from Cambodia (3.0%, a difference of 0.19%).
| Demographics | Rating | Rank | Hearing Disability |
| Immigrants | Lebanon | 71.5 /100 | #154 | Good 2.9% |
| Costa Ricans | 71.4 /100 | #155 | Good 2.9% |
| Immigrants | Poland | 70.2 /100 | #156 | Good 2.9% |
| Immigrants | Kazakhstan | 69.6 /100 | #157 | Good 2.9% |
| Immigrants | Burma/Myanmar | 69.5 /100 | #158 | Good 2.9% |
| Immigrants | Australia | 67.4 /100 | #159 | Good 2.9% |
| Immigrants | Fiji | 67.1 /100 | #160 | Good 2.9% |
| Albanians | 66.6 /100 | #161 | Good 2.9% |
| Immigrants | Japan | 66.3 /100 | #162 | Good 2.9% |
| Immigrants | Central America | 64.9 /100 | #163 | Good 3.0% |
| Immigrants | Cambodia | 64.8 /100 | #164 | Good 3.0% |
| Immigrants | Zimbabwe | 64.2 /100 | #165 | Good 3.0% |
| Immigrants | South Eastern Asia | 62.9 /100 | #166 | Good 3.0% |
| Immigrants | Eastern Europe | 58.1 /100 | #167 | Average 3.0% |
| Immigrants | Greece | 57.9 /100 | #168 | Average 3.0% |