Finnish vs American Hearing Disability
COMPARE
Finnish
American
Hearing Disability
Hearing Disability Comparison
Finns
Americans
3.7%
HEARING DISABILITY
0.0/ 100
METRIC RATING
291st/ 347
METRIC RANK
3.9%
HEARING DISABILITY
0.0/ 100
METRIC RATING
311th/ 347
METRIC RANK
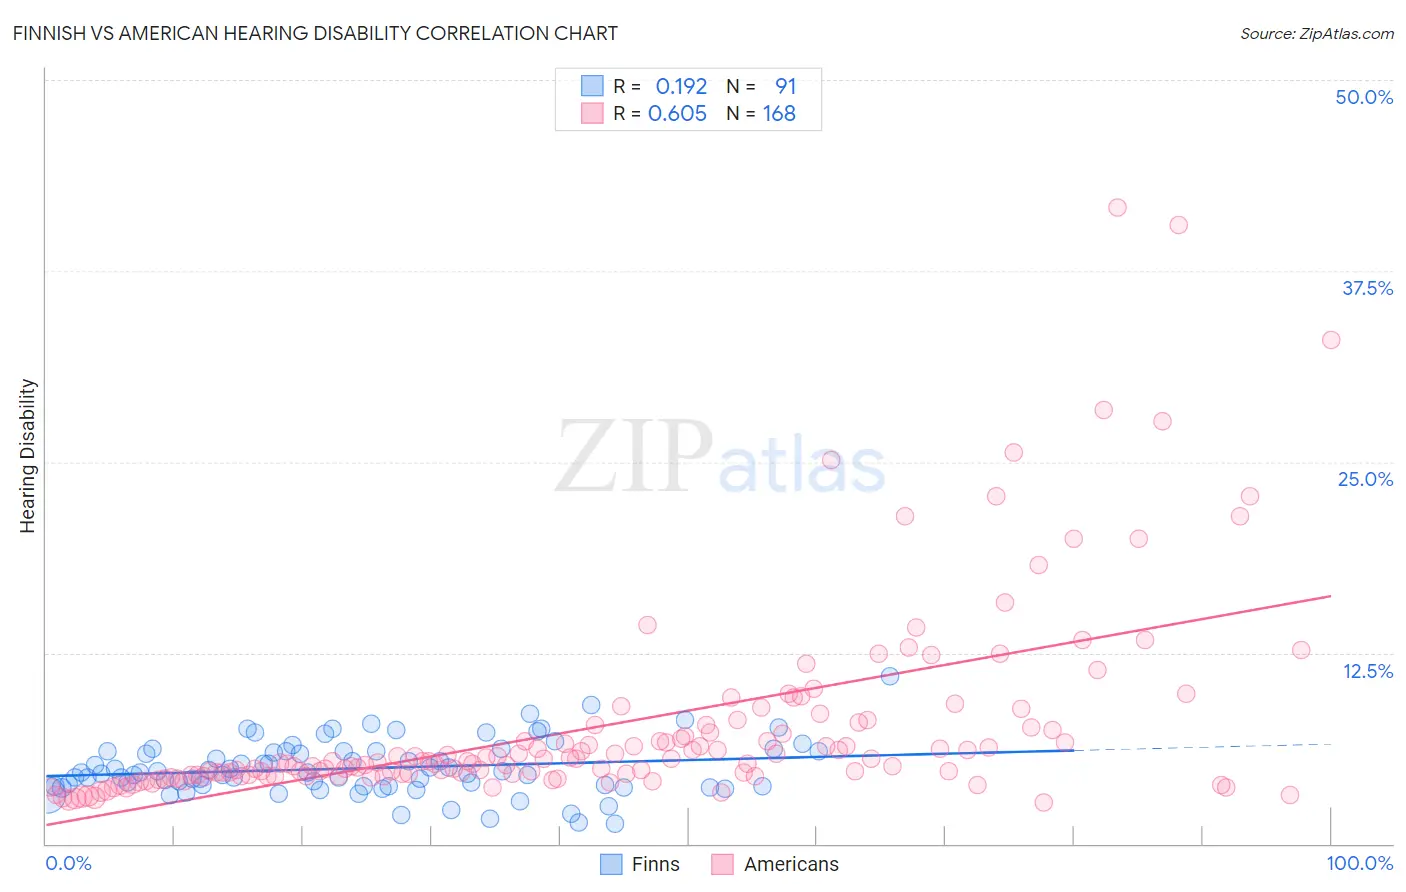
Finnish vs American Hearing Disability Correlation Chart
The statistical analysis conducted on geographies consisting of 404,503,893 people shows a poor positive correlation between the proportion of Finns and percentage of population with hearing disability in the United States with a correlation coefficient (R) of 0.192 and weighted average of 3.7%. Similarly, the statistical analysis conducted on geographies consisting of 581,034,081 people shows a significant positive correlation between the proportion of Americans and percentage of population with hearing disability in the United States with a correlation coefficient (R) of 0.605 and weighted average of 3.9%, a difference of 5.7%.
Hearing Disability Correlation Summary
| Measurement | Finnish | American |
| Minimum | 1.3% | 2.7% |
| Maximum | 10.9% | 41.7% |
| Range | 9.7% | 38.9% |
| Mean | 4.9% | 7.7% |
| Median | 4.6% | 5.4% |
| Interquartile 25% (IQ1) | 3.8% | 4.5% |
| Interquartile 75% (IQ3) | 6.0% | 7.7% |
| Interquartile Range (IQR) | 2.3% | 3.2% |
| Standard Deviation (Sample) | 1.8% | 6.5% |
| Standard Deviation (Population) | 1.8% | 6.5% |
Demographics Similar to Finns and Americans by Hearing Disability
In terms of hearing disability, the demographic groups most similar to Finns are Native Hawaiian (3.7%, a difference of 0.060%), Norwegian (3.7%, a difference of 0.12%), Iroquois (3.7%, a difference of 0.36%), Welsh (3.7%, a difference of 0.63%), and Pima (3.7%, a difference of 0.76%). Similarly, the demographic groups most similar to Americans are Cree (3.8%, a difference of 1.3%), Scotch-Irish (3.8%, a difference of 1.7%), Ottawa (3.8%, a difference of 1.7%), French Canadian (3.8%, a difference of 2.2%), and Marshallese (3.8%, a difference of 2.3%).
| Demographics | Rating | Rank | Hearing Disability |
| Finns | 0.0 /100 | #291 | Tragic 3.7% |
| Native Hawaiians | 0.0 /100 | #292 | Tragic 3.7% |
| Norwegians | 0.0 /100 | #293 | Tragic 3.7% |
| Iroquois | 0.0 /100 | #294 | Tragic 3.7% |
| Welsh | 0.0 /100 | #295 | Tragic 3.7% |
| Pima | 0.0 /100 | #296 | Tragic 3.7% |
| Immigrants | Azores | 0.0 /100 | #297 | Tragic 3.7% |
| Celtics | 0.0 /100 | #298 | Tragic 3.7% |
| Germans | 0.0 /100 | #299 | Tragic 3.7% |
| Scottish | 0.0 /100 | #300 | Tragic 3.7% |
| Pennsylvania Germans | 0.0 /100 | #301 | Tragic 3.7% |
| Dutch | 0.0 /100 | #302 | Tragic 3.7% |
| Menominee | 0.0 /100 | #303 | Tragic 3.7% |
| French | 0.0 /100 | #304 | Tragic 3.8% |
| English | 0.0 /100 | #305 | Tragic 3.8% |
| Marshallese | 0.0 /100 | #306 | Tragic 3.8% |
| French Canadians | 0.0 /100 | #307 | Tragic 3.8% |
| Ottawa | 0.0 /100 | #308 | Tragic 3.8% |
| Scotch-Irish | 0.0 /100 | #309 | Tragic 3.8% |
| Cree | 0.0 /100 | #310 | Tragic 3.8% |
| Americans | 0.0 /100 | #311 | Tragic 3.9% |