Finnish vs Taiwanese Hearing Disability
COMPARE
Finnish
Taiwanese
Hearing Disability
Hearing Disability Comparison
Finns
Taiwanese
3.7%
HEARING DISABILITY
0.0/ 100
METRIC RATING
291st/ 347
METRIC RANK
2.8%
HEARING DISABILITY
94.8/ 100
METRIC RATING
102nd/ 347
METRIC RANK
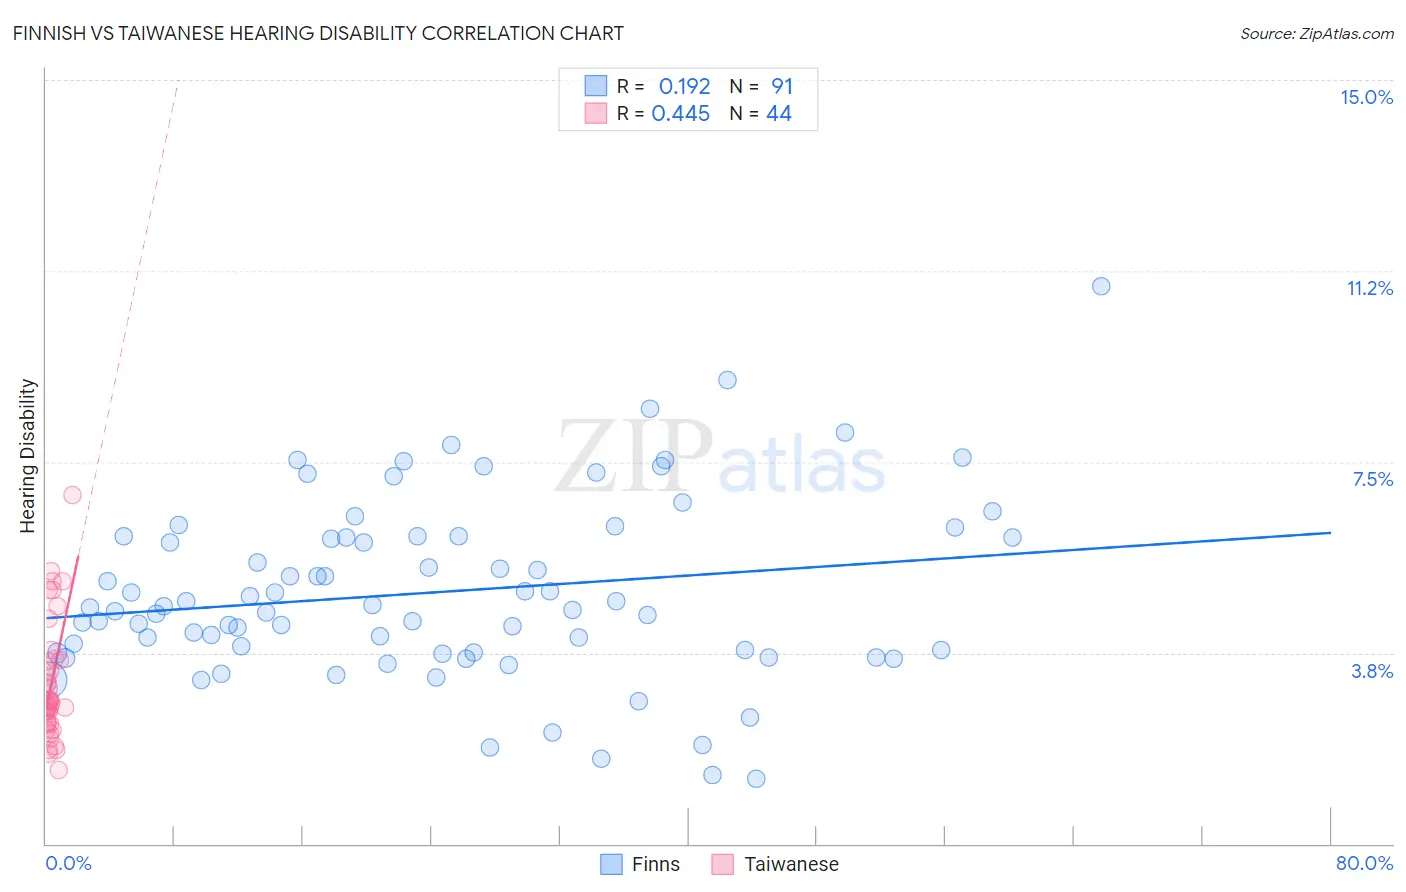
Finnish vs Taiwanese Hearing Disability Correlation Chart
The statistical analysis conducted on geographies consisting of 404,503,893 people shows a poor positive correlation between the proportion of Finns and percentage of population with hearing disability in the United States with a correlation coefficient (R) of 0.192 and weighted average of 3.7%. Similarly, the statistical analysis conducted on geographies consisting of 31,724,936 people shows a moderate positive correlation between the proportion of Taiwanese and percentage of population with hearing disability in the United States with a correlation coefficient (R) of 0.445 and weighted average of 2.8%, a difference of 32.1%.
Hearing Disability Correlation Summary
| Measurement | Finnish | Taiwanese |
| Minimum | 1.3% | 1.5% |
| Maximum | 10.9% | 6.9% |
| Range | 9.7% | 5.4% |
| Mean | 4.9% | 3.1% |
| Median | 4.6% | 2.8% |
| Interquartile 25% (IQ1) | 3.8% | 2.4% |
| Interquartile 75% (IQ3) | 6.0% | 3.6% |
| Interquartile Range (IQR) | 2.3% | 1.2% |
| Standard Deviation (Sample) | 1.8% | 1.2% |
| Standard Deviation (Population) | 1.8% | 1.1% |
Similar Demographics by Hearing Disability
Demographics Similar to Finns by Hearing Disability
In terms of hearing disability, the demographic groups most similar to Finns are White/Caucasian (3.7%, a difference of 0.010%), Native Hawaiian (3.7%, a difference of 0.060%), Norwegian (3.7%, a difference of 0.12%), Chinese (3.7%, a difference of 0.15%), and Irish (3.7%, a difference of 0.35%).
| Demographics | Rating | Rank | Hearing Disability |
| Immigrants | Micronesia | 0.0 /100 | #284 | Tragic 3.6% |
| Sioux | 0.0 /100 | #285 | Tragic 3.6% |
| Delaware | 0.0 /100 | #286 | Tragic 3.6% |
| Spanish | 0.0 /100 | #287 | Tragic 3.7% |
| Irish | 0.0 /100 | #288 | Tragic 3.7% |
| Chinese | 0.0 /100 | #289 | Tragic 3.7% |
| Whites/Caucasians | 0.0 /100 | #290 | Tragic 3.7% |
| Finns | 0.0 /100 | #291 | Tragic 3.7% |
| Native Hawaiians | 0.0 /100 | #292 | Tragic 3.7% |
| Norwegians | 0.0 /100 | #293 | Tragic 3.7% |
| Iroquois | 0.0 /100 | #294 | Tragic 3.7% |
| Welsh | 0.0 /100 | #295 | Tragic 3.7% |
| Pima | 0.0 /100 | #296 | Tragic 3.7% |
| Immigrants | Azores | 0.0 /100 | #297 | Tragic 3.7% |
| Celtics | 0.0 /100 | #298 | Tragic 3.7% |
Demographics Similar to Taiwanese by Hearing Disability
In terms of hearing disability, the demographic groups most similar to Taiwanese are Immigrants from Spain (2.8%, a difference of 0.010%), Immigrants from Indonesia (2.8%, a difference of 0.050%), Immigrants from Eastern Africa (2.8%, a difference of 0.070%), Immigrants from Guatemala (2.8%, a difference of 0.12%), and Immigrants from Honduras (2.8%, a difference of 0.16%).
| Demographics | Rating | Rank | Hearing Disability |
| Israelis | 95.9 /100 | #95 | Exceptional 2.8% |
| Immigrants | Somalia | 95.5 /100 | #96 | Exceptional 2.8% |
| Immigrants | Afghanistan | 95.3 /100 | #97 | Exceptional 2.8% |
| Immigrants | Honduras | 95.1 /100 | #98 | Exceptional 2.8% |
| Immigrants | Guatemala | 95.1 /100 | #99 | Exceptional 2.8% |
| Immigrants | Eastern Africa | 95.0 /100 | #100 | Exceptional 2.8% |
| Immigrants | Spain | 94.9 /100 | #101 | Exceptional 2.8% |
| Taiwanese | 94.8 /100 | #102 | Exceptional 2.8% |
| Immigrants | Indonesia | 94.7 /100 | #103 | Exceptional 2.8% |
| Burmese | 94.2 /100 | #104 | Exceptional 2.8% |
| Moroccans | 93.9 /100 | #105 | Exceptional 2.8% |
| Hondurans | 93.4 /100 | #106 | Exceptional 2.8% |
| Immigrants | Chile | 93.4 /100 | #107 | Exceptional 2.8% |
| Guatemalans | 93.2 /100 | #108 | Exceptional 2.8% |
| Turks | 93.0 /100 | #109 | Exceptional 2.8% |