Ethiopian vs Immigrants from Western Asia Hearing Disability
COMPARE
Ethiopian
Immigrants from Western Asia
Hearing Disability
Hearing Disability Comparison
Ethiopians
Immigrants from Western Asia
2.7%
HEARING DISABILITY
99.0/ 100
METRIC RATING
54th/ 347
METRIC RANK
2.9%
HEARING DISABILITY
86.9/ 100
METRIC RATING
128th/ 347
METRIC RANK
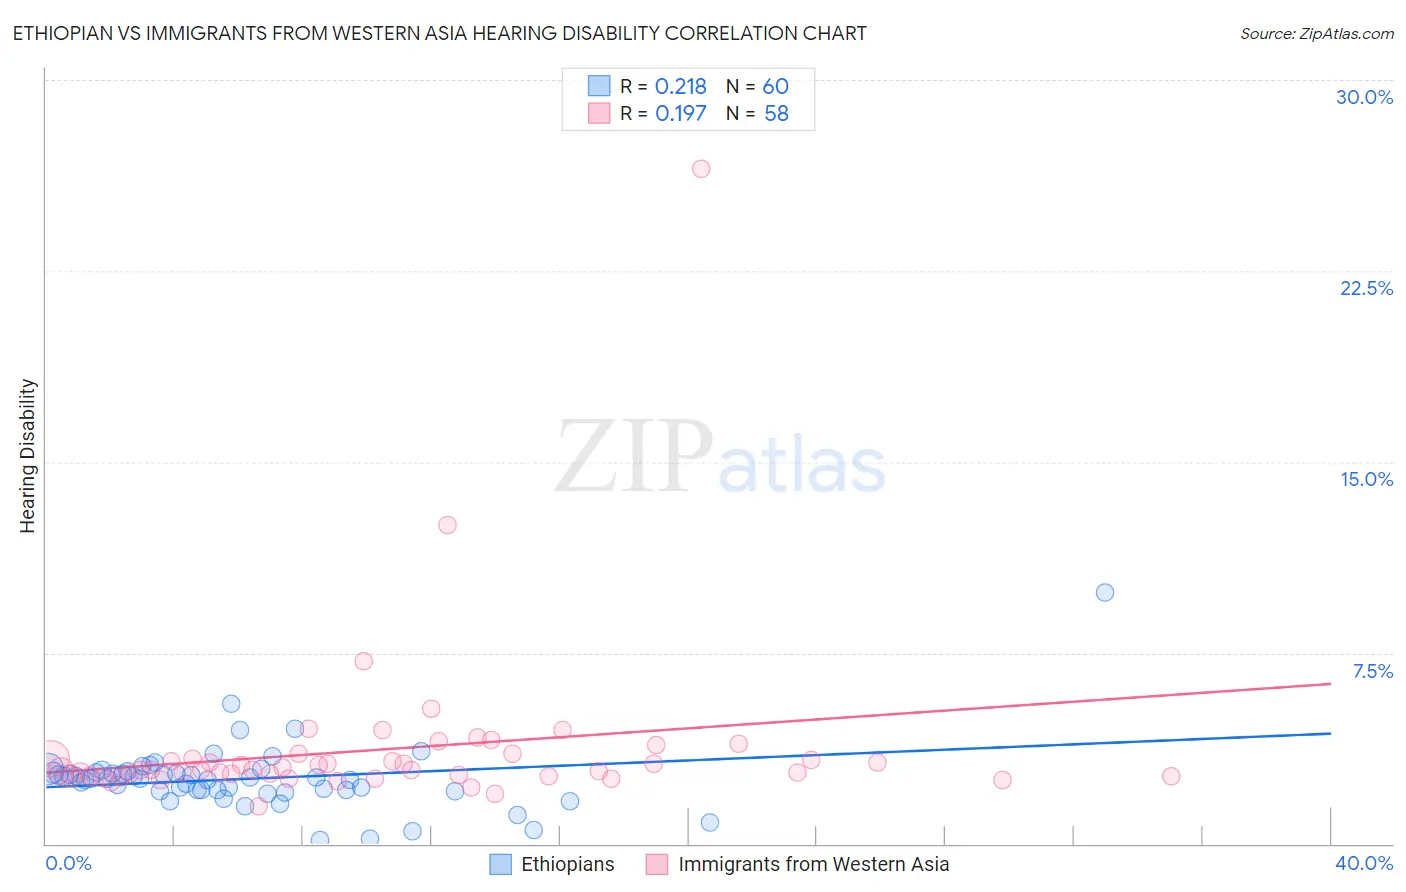
Ethiopian vs Immigrants from Western Asia Hearing Disability Correlation Chart
The statistical analysis conducted on geographies consisting of 223,190,203 people shows a weak positive correlation between the proportion of Ethiopians and percentage of population with hearing disability in the United States with a correlation coefficient (R) of 0.218 and weighted average of 2.7%. Similarly, the statistical analysis conducted on geographies consisting of 404,322,265 people shows a poor positive correlation between the proportion of Immigrants from Western Asia and percentage of population with hearing disability in the United States with a correlation coefficient (R) of 0.197 and weighted average of 2.9%, a difference of 7.1%.
Hearing Disability Correlation Summary
| Measurement | Ethiopian | Immigrants from Western Asia |
| Minimum | 0.17% | 1.5% |
| Maximum | 9.9% | 26.5% |
| Range | 9.7% | 25.0% |
| Mean | 2.5% | 3.7% |
| Median | 2.5% | 2.9% |
| Interquartile 25% (IQ1) | 2.1% | 2.6% |
| Interquartile 75% (IQ3) | 2.8% | 3.4% |
| Interquartile Range (IQR) | 0.70% | 0.72% |
| Standard Deviation (Sample) | 1.3% | 3.4% |
| Standard Deviation (Population) | 1.3% | 3.4% |
Similar Demographics by Hearing Disability
Demographics Similar to Ethiopians by Hearing Disability
In terms of hearing disability, the demographic groups most similar to Ethiopians are Immigrants from Eastern Asia (2.7%, a difference of 0.030%), Immigrants from Ethiopia (2.7%, a difference of 0.060%), Immigrants from Nicaragua (2.7%, a difference of 0.090%), Jamaican (2.7%, a difference of 0.10%), and South American (2.7%, a difference of 0.13%).
| Demographics | Rating | Rank | Hearing Disability |
| Immigrants | Israel | 99.3 /100 | #47 | Exceptional 2.6% |
| Immigrants | Singapore | 99.3 /100 | #48 | Exceptional 2.6% |
| Immigrants | South America | 99.2 /100 | #49 | Exceptional 2.7% |
| Paraguayans | 99.2 /100 | #50 | Exceptional 2.7% |
| Immigrants | Hong Kong | 99.2 /100 | #51 | Exceptional 2.7% |
| Jamaicans | 99.0 /100 | #52 | Exceptional 2.7% |
| Immigrants | Eastern Asia | 99.0 /100 | #53 | Exceptional 2.7% |
| Ethiopians | 99.0 /100 | #54 | Exceptional 2.7% |
| Immigrants | Ethiopia | 99.0 /100 | #55 | Exceptional 2.7% |
| Immigrants | Nicaragua | 99.0 /100 | #56 | Exceptional 2.7% |
| South Americans | 99.0 /100 | #57 | Exceptional 2.7% |
| Immigrants | Peru | 98.6 /100 | #58 | Exceptional 2.7% |
| Immigrants | Eritrea | 98.5 /100 | #59 | Exceptional 2.7% |
| Immigrants | Egypt | 98.5 /100 | #60 | Exceptional 2.7% |
| Immigrants | Uzbekistan | 98.4 /100 | #61 | Exceptional 2.7% |
Demographics Similar to Immigrants from Western Asia by Hearing Disability
In terms of hearing disability, the demographic groups most similar to Immigrants from Western Asia are South American Indian (2.9%, a difference of 0.0%), Immigrants from Uganda (2.9%, a difference of 0.050%), Immigrants from Vietnam (2.9%, a difference of 0.070%), Immigrants from Kenya (2.9%, a difference of 0.16%), and Chilean (2.9%, a difference of 0.21%).
| Demographics | Rating | Rank | Hearing Disability |
| Cubans | 89.4 /100 | #121 | Excellent 2.8% |
| Liberians | 89.0 /100 | #122 | Excellent 2.8% |
| Immigrants | Zaire | 88.6 /100 | #123 | Excellent 2.9% |
| Bahamians | 88.6 /100 | #124 | Excellent 2.9% |
| Immigrants | Albania | 88.5 /100 | #125 | Excellent 2.9% |
| Immigrants | Sudan | 87.8 /100 | #126 | Excellent 2.9% |
| South American Indians | 86.9 /100 | #127 | Excellent 2.9% |
| Immigrants | Western Asia | 86.9 /100 | #128 | Excellent 2.9% |
| Immigrants | Uganda | 86.6 /100 | #129 | Excellent 2.9% |
| Immigrants | Vietnam | 86.5 /100 | #130 | Excellent 2.9% |
| Immigrants | Kenya | 86.1 /100 | #131 | Excellent 2.9% |
| Chileans | 85.8 /100 | #132 | Excellent 2.9% |
| Immigrants | Syria | 85.8 /100 | #133 | Excellent 2.9% |
| Ugandans | 85.5 /100 | #134 | Excellent 2.9% |
| Soviet Union | 84.8 /100 | #135 | Excellent 2.9% |