Immigrants from Laos vs Immigrants from Western Asia Hearing Disability
COMPARE
Immigrants from Laos
Immigrants from Western Asia
Hearing Disability
Hearing Disability Comparison
Immigrants from Laos
Immigrants from Western Asia
3.2%
HEARING DISABILITY
6.6/ 100
METRIC RATING
221st/ 347
METRIC RANK
2.9%
HEARING DISABILITY
86.9/ 100
METRIC RATING
128th/ 347
METRIC RANK
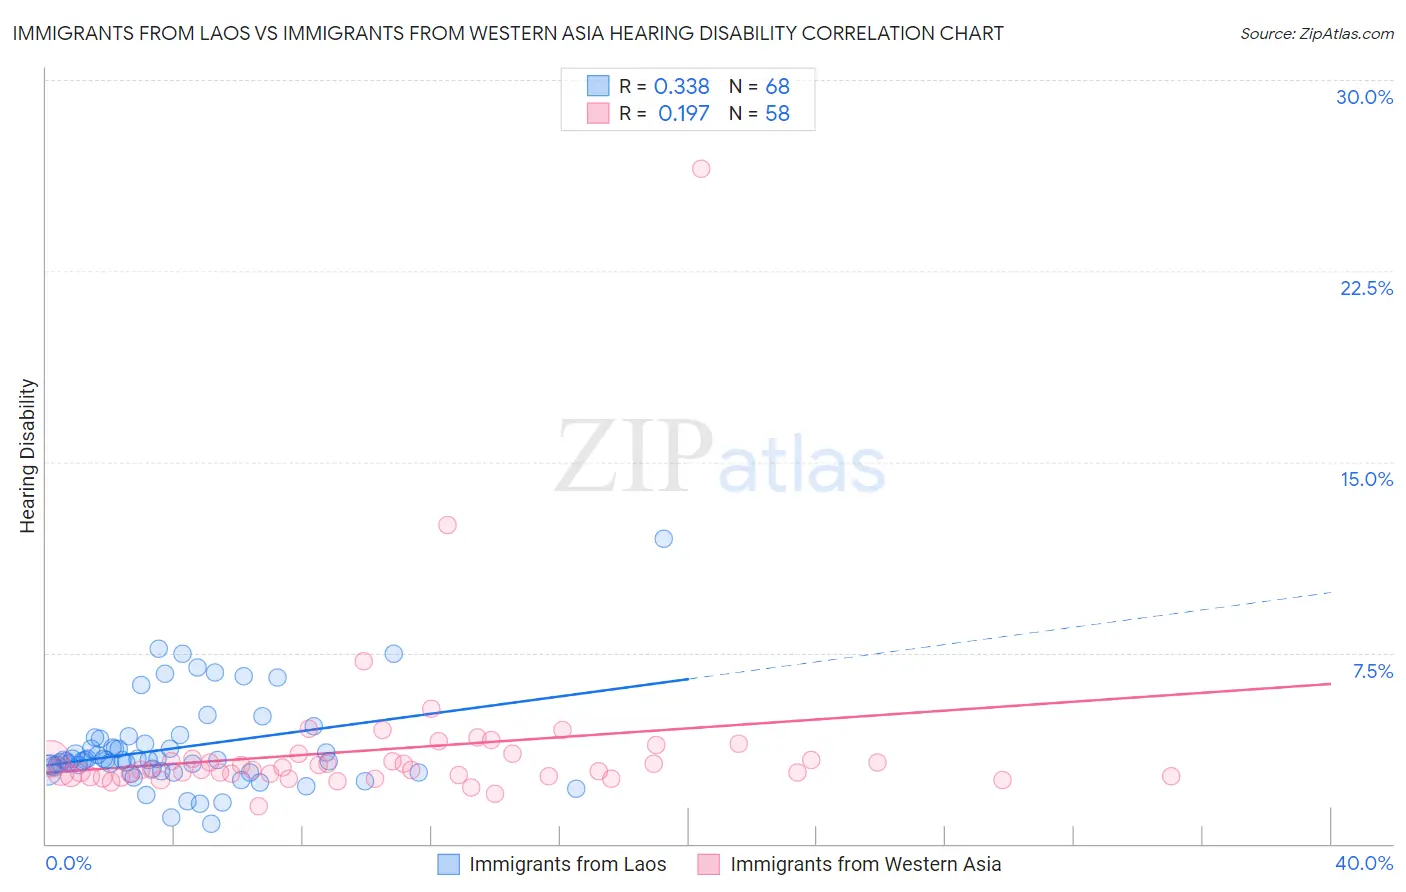
Immigrants from Laos vs Immigrants from Western Asia Hearing Disability Correlation Chart
The statistical analysis conducted on geographies consisting of 201,463,396 people shows a mild positive correlation between the proportion of Immigrants from Laos and percentage of population with hearing disability in the United States with a correlation coefficient (R) of 0.338 and weighted average of 3.2%. Similarly, the statistical analysis conducted on geographies consisting of 404,322,265 people shows a poor positive correlation between the proportion of Immigrants from Western Asia and percentage of population with hearing disability in the United States with a correlation coefficient (R) of 0.197 and weighted average of 2.9%, a difference of 11.1%.
Hearing Disability Correlation Summary
| Measurement | Immigrants from Laos | Immigrants from Western Asia |
| Minimum | 0.79% | 1.5% |
| Maximum | 12.0% | 26.5% |
| Range | 11.2% | 25.0% |
| Mean | 3.8% | 3.7% |
| Median | 3.3% | 2.9% |
| Interquartile 25% (IQ1) | 2.9% | 2.6% |
| Interquartile 75% (IQ3) | 4.0% | 3.4% |
| Interquartile Range (IQR) | 1.2% | 0.72% |
| Standard Deviation (Sample) | 1.8% | 3.4% |
| Standard Deviation (Population) | 1.8% | 3.4% |
Similar Demographics by Hearing Disability
Demographics Similar to Immigrants from Laos by Hearing Disability
In terms of hearing disability, the demographic groups most similar to Immigrants from Laos are Malaysian (3.2%, a difference of 0.0%), Immigrants from Oceania (3.2%, a difference of 0.040%), New Zealander (3.2%, a difference of 0.060%), Immigrants from Northern Europe (3.2%, a difference of 0.12%), and Russian (3.2%, a difference of 0.16%).
| Demographics | Rating | Rank | Hearing Disability |
| Australians | 8.1 /100 | #214 | Tragic 3.2% |
| Bangladeshis | 8.1 /100 | #215 | Tragic 3.2% |
| Immigrants | Norway | 7.3 /100 | #216 | Tragic 3.2% |
| Russians | 7.1 /100 | #217 | Tragic 3.2% |
| Immigrants | Northern Europe | 7.0 /100 | #218 | Tragic 3.2% |
| New Zealanders | 6.8 /100 | #219 | Tragic 3.2% |
| Malaysians | 6.6 /100 | #220 | Tragic 3.2% |
| Immigrants | Laos | 6.6 /100 | #221 | Tragic 3.2% |
| Immigrants | Oceania | 6.5 /100 | #222 | Tragic 3.2% |
| Mexicans | 5.6 /100 | #223 | Tragic 3.2% |
| Icelanders | 5.2 /100 | #224 | Tragic 3.2% |
| Latvians | 5.1 /100 | #225 | Tragic 3.2% |
| Lebanese | 5.0 /100 | #226 | Tragic 3.2% |
| Bhutanese | 4.6 /100 | #227 | Tragic 3.2% |
| Immigrants | Portugal | 4.3 /100 | #228 | Tragic 3.2% |
Demographics Similar to Immigrants from Western Asia by Hearing Disability
In terms of hearing disability, the demographic groups most similar to Immigrants from Western Asia are South American Indian (2.9%, a difference of 0.0%), Immigrants from Uganda (2.9%, a difference of 0.050%), Immigrants from Vietnam (2.9%, a difference of 0.070%), Immigrants from Kenya (2.9%, a difference of 0.16%), and Chilean (2.9%, a difference of 0.21%).
| Demographics | Rating | Rank | Hearing Disability |
| Cubans | 89.4 /100 | #121 | Excellent 2.8% |
| Liberians | 89.0 /100 | #122 | Excellent 2.8% |
| Immigrants | Zaire | 88.6 /100 | #123 | Excellent 2.9% |
| Bahamians | 88.6 /100 | #124 | Excellent 2.9% |
| Immigrants | Albania | 88.5 /100 | #125 | Excellent 2.9% |
| Immigrants | Sudan | 87.8 /100 | #126 | Excellent 2.9% |
| South American Indians | 86.9 /100 | #127 | Excellent 2.9% |
| Immigrants | Western Asia | 86.9 /100 | #128 | Excellent 2.9% |
| Immigrants | Uganda | 86.6 /100 | #129 | Excellent 2.9% |
| Immigrants | Vietnam | 86.5 /100 | #130 | Excellent 2.9% |
| Immigrants | Kenya | 86.1 /100 | #131 | Excellent 2.9% |
| Chileans | 85.8 /100 | #132 | Excellent 2.9% |
| Immigrants | Syria | 85.8 /100 | #133 | Excellent 2.9% |
| Ugandans | 85.5 /100 | #134 | Excellent 2.9% |
| Soviet Union | 84.8 /100 | #135 | Excellent 2.9% |