Ethiopian vs Immigrants from Western Asia Householder Income Ages 45 - 64 years
COMPARE
Ethiopian
Immigrants from Western Asia
Householder Income Ages 45 - 64 years
Householder Income Ages 45 - 64 years Comparison
Ethiopians
Immigrants from Western Asia
$103,736
HOUSEHOLDER INCOME AGES 45 - 64 YEARS
84.7/ 100
METRIC RATING
138th/ 347
METRIC RANK
$106,217
HOUSEHOLDER INCOME AGES 45 - 64 YEARS
95.0/ 100
METRIC RATING
118th/ 347
METRIC RANK
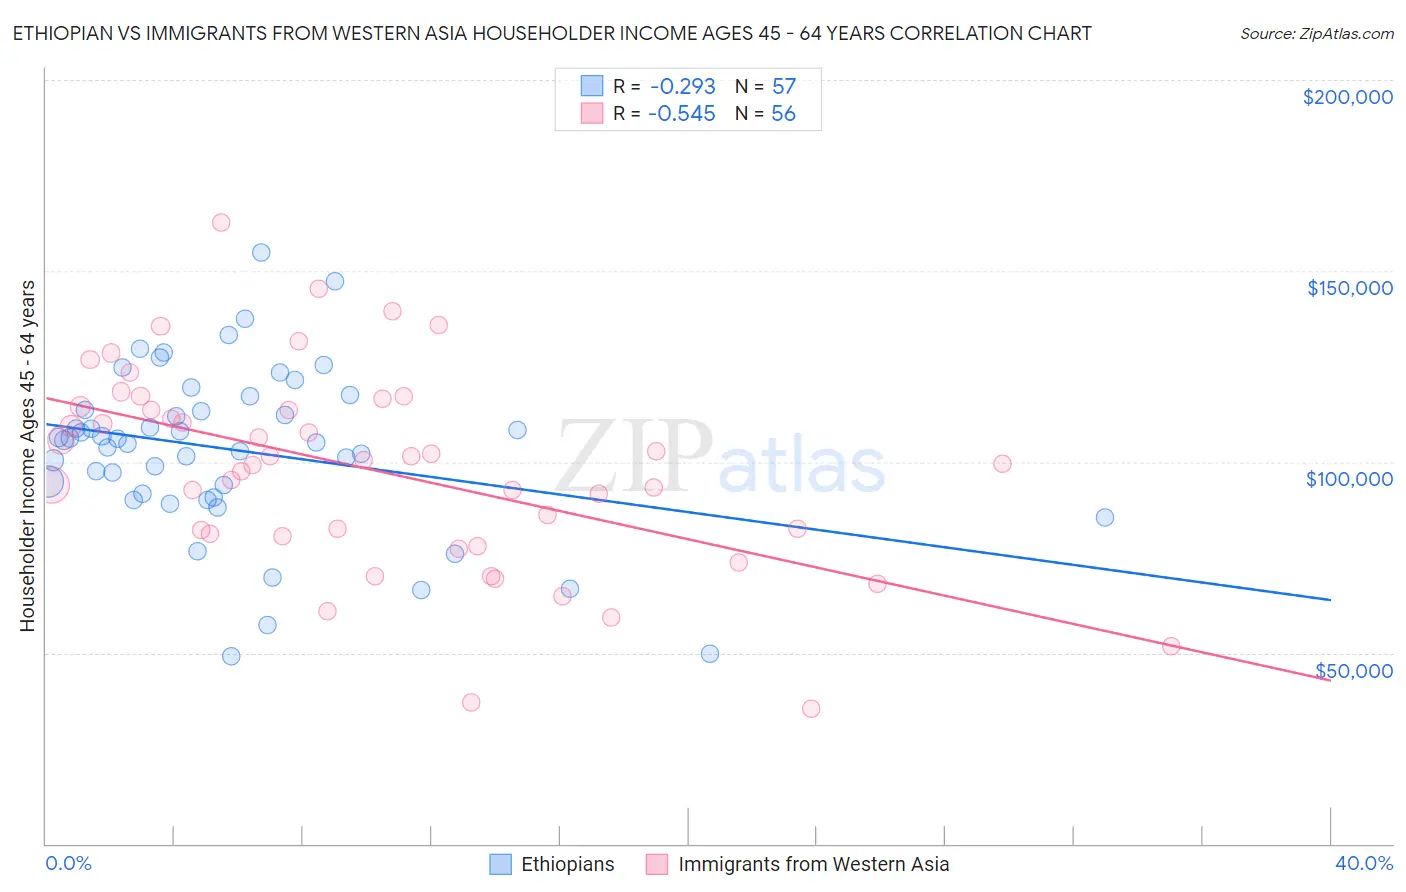
Ethiopian vs Immigrants from Western Asia Householder Income Ages 45 - 64 years Correlation Chart
The statistical analysis conducted on geographies consisting of 222,913,789 people shows a weak negative correlation between the proportion of Ethiopians and household income with householder between the ages 45 and 64 in the United States with a correlation coefficient (R) of -0.293 and weighted average of $103,736. Similarly, the statistical analysis conducted on geographies consisting of 403,788,110 people shows a substantial negative correlation between the proportion of Immigrants from Western Asia and household income with householder between the ages 45 and 64 in the United States with a correlation coefficient (R) of -0.545 and weighted average of $106,217, a difference of 2.4%.
Householder Income Ages 45 - 64 years Correlation Summary
| Measurement | Ethiopian | Immigrants from Western Asia |
| Minimum | $48,981 | $35,250 |
| Maximum | $154,904 | $162,741 |
| Range | $105,923 | $127,491 |
| Mean | $103,166 | $97,778 |
| Median | $105,724 | $100,060 |
| Interquartile 25% (IQ1) | $91,126 | $80,918 |
| Interquartile 75% (IQ3) | $115,330 | $113,930 |
| Interquartile Range (IQR) | $24,204 | $33,012 |
| Standard Deviation (Sample) | $21,688 | $26,213 |
| Standard Deviation (Population) | $21,497 | $25,977 |
Demographics Similar to Ethiopians and Immigrants from Western Asia by Householder Income Ages 45 - 64 years
In terms of householder income ages 45 - 64 years, the demographic groups most similar to Ethiopians are Hungarian ($103,913, a difference of 0.17%), Taiwanese ($104,180, a difference of 0.43%), Brazilian ($104,408, a difference of 0.65%), Canadian ($104,560, a difference of 0.79%), and Arab ($104,566, a difference of 0.80%). Similarly, the demographic groups most similar to Immigrants from Western Asia are Immigrants from Jordan ($106,164, a difference of 0.050%), Immigrants from South Eastern Asia ($106,109, a difference of 0.10%), Polish ($105,952, a difference of 0.25%), Immigrants from North Macedonia ($105,892, a difference of 0.31%), and Danish ($105,619, a difference of 0.57%).
| Demographics | Rating | Rank | Householder Income Ages 45 - 64 years |
| Immigrants | Western Asia | 95.0 /100 | #118 | Exceptional $106,217 |
| Immigrants | Jordan | 94.9 /100 | #119 | Exceptional $106,164 |
| Immigrants | South Eastern Asia | 94.8 /100 | #120 | Exceptional $106,109 |
| Poles | 94.4 /100 | #121 | Exceptional $105,952 |
| Immigrants | North Macedonia | 94.2 /100 | #122 | Exceptional $105,892 |
| Danes | 93.4 /100 | #123 | Exceptional $105,619 |
| Immigrants | Northern Africa | 92.8 /100 | #124 | Exceptional $105,430 |
| Pakistanis | 92.4 /100 | #125 | Exceptional $105,317 |
| Portuguese | 92.4 /100 | #126 | Exceptional $105,309 |
| Immigrants | Saudi Arabia | 92.2 /100 | #127 | Exceptional $105,249 |
| Native Hawaiians | 91.8 /100 | #128 | Exceptional $105,149 |
| Peruvians | 91.5 /100 | #129 | Exceptional $105,070 |
| Immigrants | Zimbabwe | 91.2 /100 | #130 | Exceptional $104,992 |
| Immigrants | Syria | 90.7 /100 | #131 | Exceptional $104,858 |
| Lebanese | 90.1 /100 | #132 | Exceptional $104,734 |
| Arabs | 89.3 /100 | #133 | Excellent $104,566 |
| Canadians | 89.3 /100 | #134 | Excellent $104,560 |
| Brazilians | 88.6 /100 | #135 | Excellent $104,408 |
| Taiwanese | 87.4 /100 | #136 | Excellent $104,180 |
| Hungarians | 85.8 /100 | #137 | Excellent $103,913 |
| Ethiopians | 84.7 /100 | #138 | Excellent $103,736 |