British vs Immigrants from Western Asia Hearing Disability
COMPARE
British
Immigrants from Western Asia
Hearing Disability
Hearing Disability Comparison
British
Immigrants from Western Asia
3.5%
HEARING DISABILITY
0.1/ 100
METRIC RATING
265th/ 347
METRIC RANK
2.9%
HEARING DISABILITY
86.9/ 100
METRIC RATING
128th/ 347
METRIC RANK
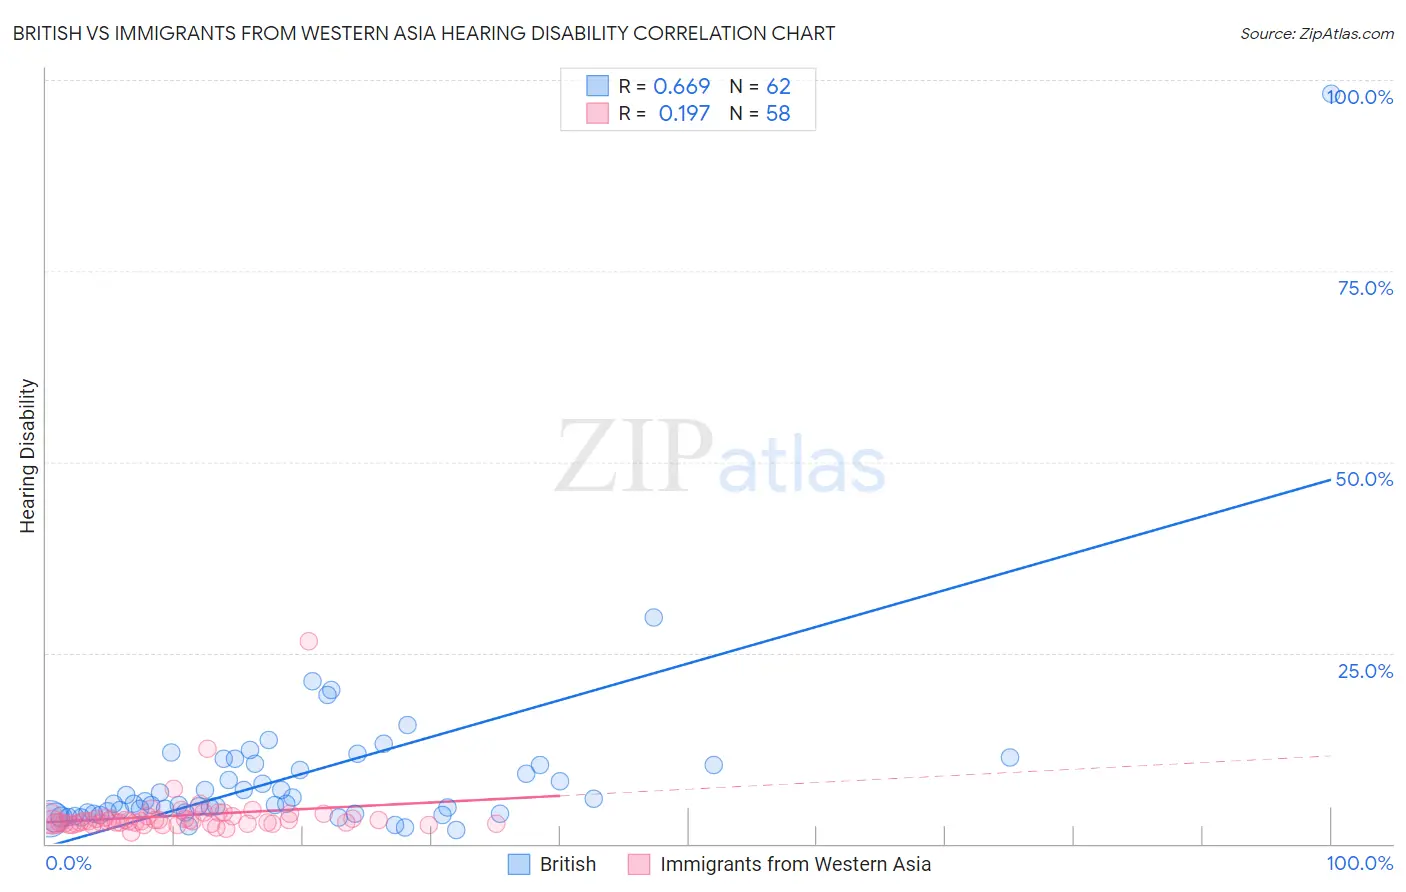
British vs Immigrants from Western Asia Hearing Disability Correlation Chart
The statistical analysis conducted on geographies consisting of 531,095,023 people shows a significant positive correlation between the proportion of British and percentage of population with hearing disability in the United States with a correlation coefficient (R) of 0.669 and weighted average of 3.5%. Similarly, the statistical analysis conducted on geographies consisting of 404,322,265 people shows a poor positive correlation between the proportion of Immigrants from Western Asia and percentage of population with hearing disability in the United States with a correlation coefficient (R) of 0.197 and weighted average of 2.9%, a difference of 21.4%.
Hearing Disability Correlation Summary
| Measurement | British | Immigrants from Western Asia |
| Minimum | 1.8% | 1.5% |
| Maximum | 98.2% | 26.5% |
| Range | 96.4% | 25.0% |
| Mean | 8.9% | 3.7% |
| Median | 5.3% | 2.9% |
| Interquartile 25% (IQ1) | 4.0% | 2.6% |
| Interquartile 75% (IQ3) | 10.4% | 3.4% |
| Interquartile Range (IQR) | 6.4% | 0.72% |
| Standard Deviation (Sample) | 12.7% | 3.4% |
| Standard Deviation (Population) | 12.6% | 3.4% |
Similar Demographics by Hearing Disability
Demographics Similar to British by Hearing Disability
In terms of hearing disability, the demographic groups most similar to British are Immigrants from Germany (3.5%, a difference of 0.020%), Belgian (3.5%, a difference of 0.18%), Immigrants from Canada (3.5%, a difference of 0.24%), Immigrants from North America (3.5%, a difference of 0.28%), and Hawaiian (3.5%, a difference of 0.39%).
| Demographics | Rating | Rank | Hearing Disability |
| Northern Europeans | 0.2 /100 | #258 | Tragic 3.4% |
| Slovenes | 0.1 /100 | #259 | Tragic 3.5% |
| Portuguese | 0.1 /100 | #260 | Tragic 3.5% |
| Hawaiians | 0.1 /100 | #261 | Tragic 3.5% |
| Immigrants | North America | 0.1 /100 | #262 | Tragic 3.5% |
| Immigrants | Canada | 0.1 /100 | #263 | Tragic 3.5% |
| Immigrants | Germany | 0.1 /100 | #264 | Tragic 3.5% |
| British | 0.1 /100 | #265 | Tragic 3.5% |
| Belgians | 0.1 /100 | #266 | Tragic 3.5% |
| Canadians | 0.1 /100 | #267 | Tragic 3.5% |
| Spaniards | 0.1 /100 | #268 | Tragic 3.5% |
| Ute | 0.1 /100 | #269 | Tragic 3.5% |
| Europeans | 0.1 /100 | #270 | Tragic 3.5% |
| Czechs | 0.1 /100 | #271 | Tragic 3.5% |
| Fijians | 0.0 /100 | #272 | Tragic 3.5% |
Demographics Similar to Immigrants from Western Asia by Hearing Disability
In terms of hearing disability, the demographic groups most similar to Immigrants from Western Asia are South American Indian (2.9%, a difference of 0.0%), Immigrants from Uganda (2.9%, a difference of 0.050%), Immigrants from Vietnam (2.9%, a difference of 0.070%), Immigrants from Kenya (2.9%, a difference of 0.16%), and Chilean (2.9%, a difference of 0.21%).
| Demographics | Rating | Rank | Hearing Disability |
| Cubans | 89.4 /100 | #121 | Excellent 2.8% |
| Liberians | 89.0 /100 | #122 | Excellent 2.8% |
| Immigrants | Zaire | 88.6 /100 | #123 | Excellent 2.9% |
| Bahamians | 88.6 /100 | #124 | Excellent 2.9% |
| Immigrants | Albania | 88.5 /100 | #125 | Excellent 2.9% |
| Immigrants | Sudan | 87.8 /100 | #126 | Excellent 2.9% |
| South American Indians | 86.9 /100 | #127 | Excellent 2.9% |
| Immigrants | Western Asia | 86.9 /100 | #128 | Excellent 2.9% |
| Immigrants | Uganda | 86.6 /100 | #129 | Excellent 2.9% |
| Immigrants | Vietnam | 86.5 /100 | #130 | Excellent 2.9% |
| Immigrants | Kenya | 86.1 /100 | #131 | Excellent 2.9% |
| Chileans | 85.8 /100 | #132 | Excellent 2.9% |
| Immigrants | Syria | 85.8 /100 | #133 | Excellent 2.9% |
| Ugandans | 85.5 /100 | #134 | Excellent 2.9% |
| Soviet Union | 84.8 /100 | #135 | Excellent 2.9% |