Jordanian vs Immigrants from Western Asia Hearing Disability
COMPARE
Jordanian
Immigrants from Western Asia
Hearing Disability
Hearing Disability Comparison
Jordanians
Immigrants from Western Asia
2.8%
HEARING DISABILITY
89.5/ 100
METRIC RATING
120th/ 347
METRIC RANK
2.9%
HEARING DISABILITY
86.9/ 100
METRIC RATING
128th/ 347
METRIC RANK
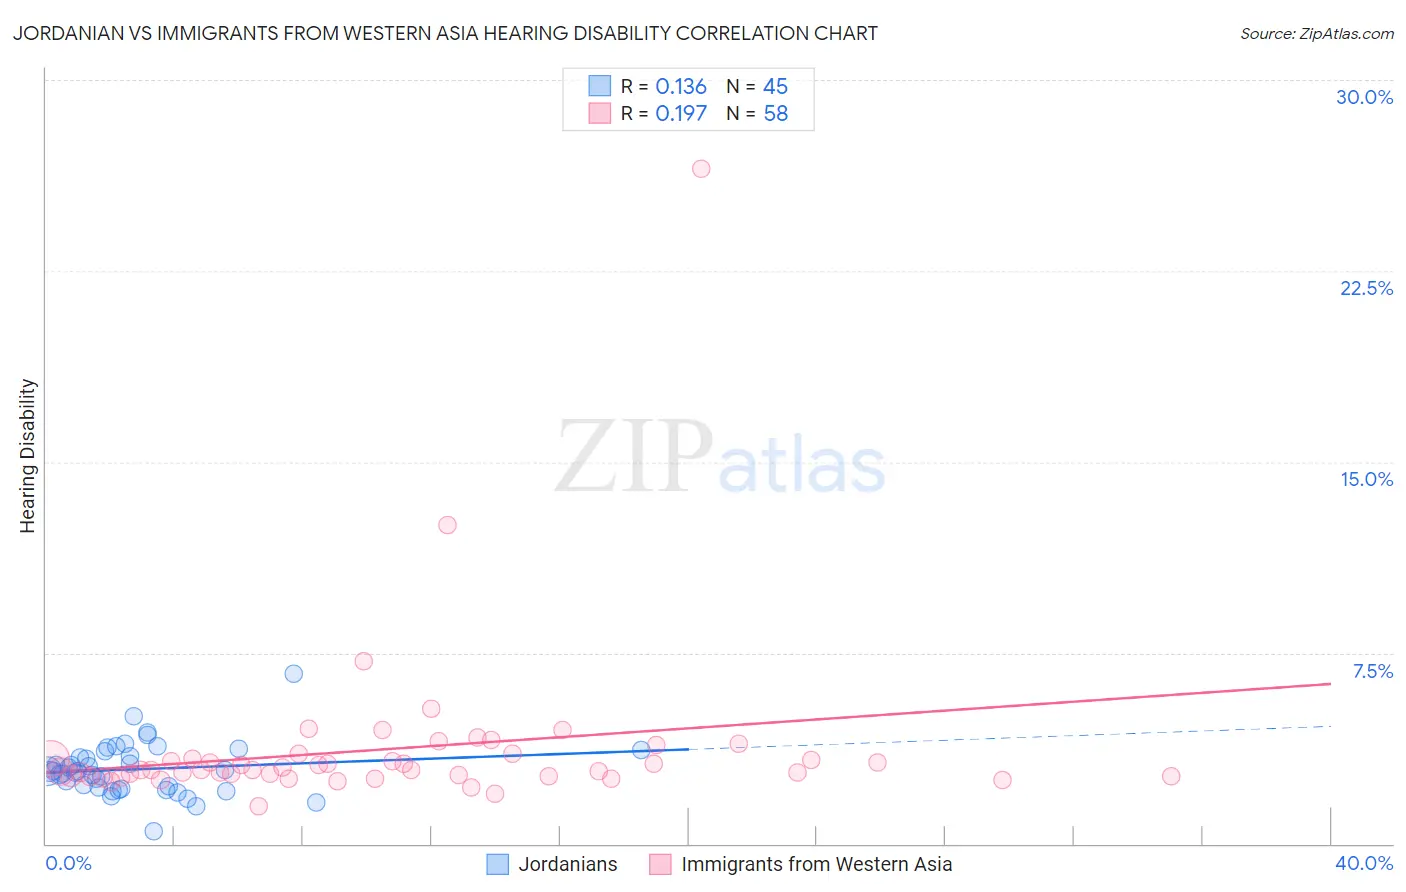
Jordanian vs Immigrants from Western Asia Hearing Disability Correlation Chart
The statistical analysis conducted on geographies consisting of 166,401,829 people shows a poor positive correlation between the proportion of Jordanians and percentage of population with hearing disability in the United States with a correlation coefficient (R) of 0.136 and weighted average of 2.8%. Similarly, the statistical analysis conducted on geographies consisting of 404,322,265 people shows a poor positive correlation between the proportion of Immigrants from Western Asia and percentage of population with hearing disability in the United States with a correlation coefficient (R) of 0.197 and weighted average of 2.9%, a difference of 0.63%.
Hearing Disability Correlation Summary
| Measurement | Jordanian | Immigrants from Western Asia |
| Minimum | 0.50% | 1.5% |
| Maximum | 6.7% | 26.5% |
| Range | 6.2% | 25.0% |
| Mean | 2.9% | 3.7% |
| Median | 2.8% | 2.9% |
| Interquartile 25% (IQ1) | 2.2% | 2.6% |
| Interquartile 75% (IQ3) | 3.5% | 3.4% |
| Interquartile Range (IQR) | 1.4% | 0.72% |
| Standard Deviation (Sample) | 1.0% | 3.4% |
| Standard Deviation (Population) | 1.0% | 3.4% |
Demographics Similar to Jordanians and Immigrants from Western Asia by Hearing Disability
In terms of hearing disability, the demographic groups most similar to Jordanians are Cuban (2.8%, a difference of 0.030%), Kenyan (2.8%, a difference of 0.090%), Zimbabwean (2.8%, a difference of 0.11%), Immigrants from Liberia (2.8%, a difference of 0.13%), and Liberian (2.8%, a difference of 0.13%). Similarly, the demographic groups most similar to Immigrants from Western Asia are South American Indian (2.9%, a difference of 0.0%), Immigrants from Uganda (2.9%, a difference of 0.050%), Immigrants from Vietnam (2.9%, a difference of 0.070%), Immigrants from Kenya (2.9%, a difference of 0.16%), and Chilean (2.9%, a difference of 0.21%).
| Demographics | Rating | Rank | Hearing Disability |
| Cambodians | 91.1 /100 | #114 | Exceptional 2.8% |
| Immigrants | Latin America | 90.5 /100 | #115 | Exceptional 2.8% |
| Immigrants | Immigrants | 90.3 /100 | #116 | Exceptional 2.8% |
| Immigrants | Liberia | 90.0 /100 | #117 | Excellent 2.8% |
| Zimbabweans | 89.9 /100 | #118 | Excellent 2.8% |
| Kenyans | 89.8 /100 | #119 | Excellent 2.8% |
| Jordanians | 89.5 /100 | #120 | Excellent 2.8% |
| Cubans | 89.4 /100 | #121 | Excellent 2.8% |
| Liberians | 89.0 /100 | #122 | Excellent 2.8% |
| Immigrants | Zaire | 88.6 /100 | #123 | Excellent 2.9% |
| Bahamians | 88.6 /100 | #124 | Excellent 2.9% |
| Immigrants | Albania | 88.5 /100 | #125 | Excellent 2.9% |
| Immigrants | Sudan | 87.8 /100 | #126 | Excellent 2.9% |
| South American Indians | 86.9 /100 | #127 | Excellent 2.9% |
| Immigrants | Western Asia | 86.9 /100 | #128 | Excellent 2.9% |
| Immigrants | Uganda | 86.6 /100 | #129 | Excellent 2.9% |
| Immigrants | Vietnam | 86.5 /100 | #130 | Excellent 2.9% |
| Immigrants | Kenya | 86.1 /100 | #131 | Excellent 2.9% |
| Chileans | 85.8 /100 | #132 | Excellent 2.9% |
| Immigrants | Syria | 85.8 /100 | #133 | Excellent 2.9% |
| Ugandans | 85.5 /100 | #134 | Excellent 2.9% |