Ethiopian vs Immigrants from Middle Africa Hearing Disability
COMPARE
Ethiopian
Immigrants from Middle Africa
Hearing Disability
Hearing Disability Comparison
Ethiopians
Immigrants from Middle Africa
2.7%
HEARING DISABILITY
99.0/ 100
METRIC RATING
54th/ 347
METRIC RANK
2.8%
HEARING DISABILITY
96.5/ 100
METRIC RATING
91st/ 347
METRIC RANK
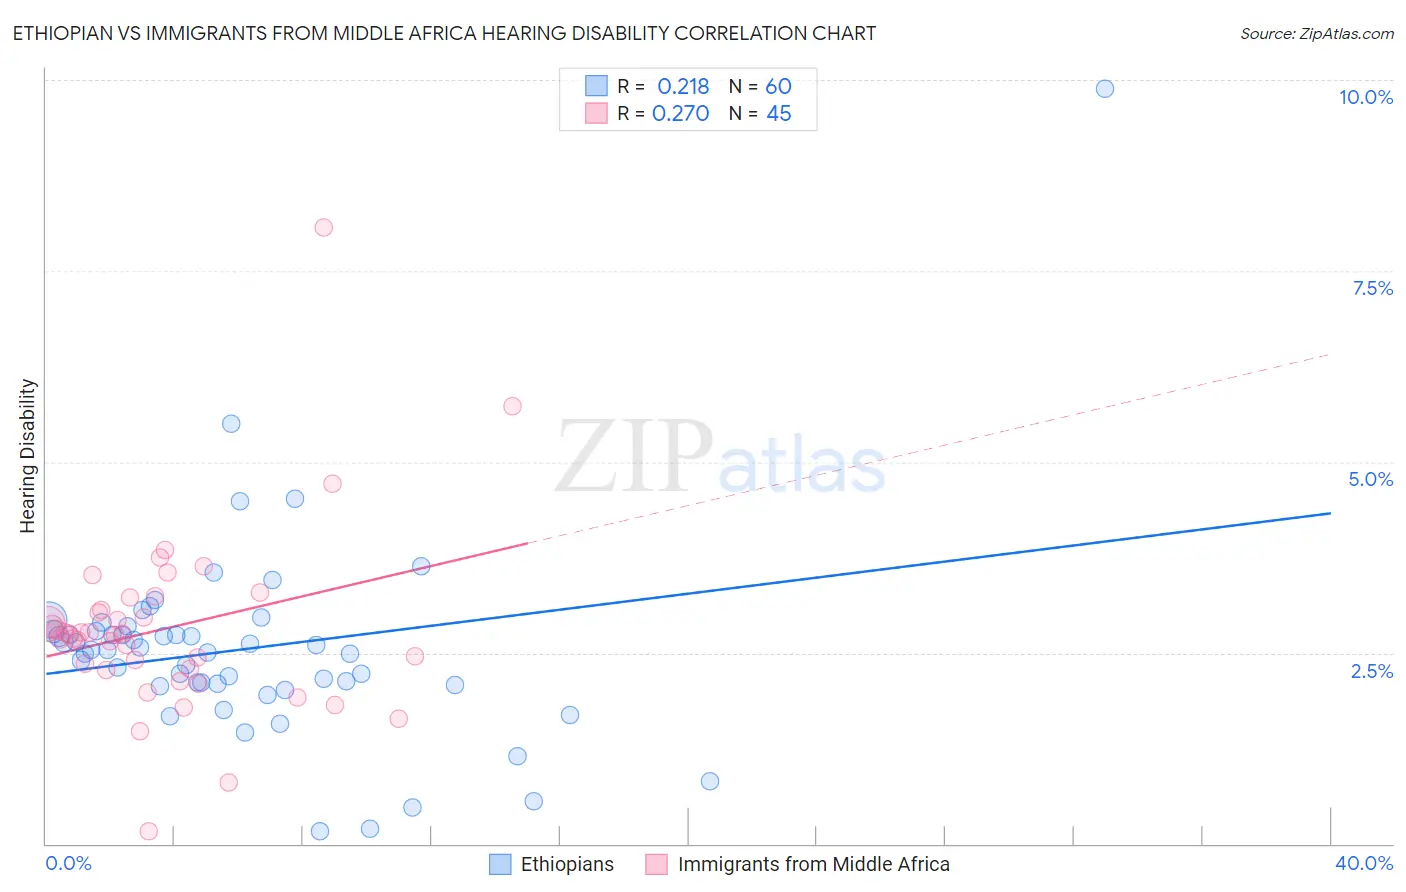
Ethiopian vs Immigrants from Middle Africa Hearing Disability Correlation Chart
The statistical analysis conducted on geographies consisting of 223,190,203 people shows a weak positive correlation between the proportion of Ethiopians and percentage of population with hearing disability in the United States with a correlation coefficient (R) of 0.218 and weighted average of 2.7%. Similarly, the statistical analysis conducted on geographies consisting of 202,695,899 people shows a weak positive correlation between the proportion of Immigrants from Middle Africa and percentage of population with hearing disability in the United States with a correlation coefficient (R) of 0.270 and weighted average of 2.8%, a difference of 3.4%.
Hearing Disability Correlation Summary
| Measurement | Ethiopian | Immigrants from Middle Africa |
| Minimum | 0.17% | 0.16% |
| Maximum | 9.9% | 8.1% |
| Range | 9.7% | 7.9% |
| Mean | 2.5% | 2.8% |
| Median | 2.5% | 2.7% |
| Interquartile 25% (IQ1) | 2.1% | 2.3% |
| Interquartile 75% (IQ3) | 2.8% | 3.1% |
| Interquartile Range (IQR) | 0.70% | 0.87% |
| Standard Deviation (Sample) | 1.3% | 1.2% |
| Standard Deviation (Population) | 1.3% | 1.2% |
Similar Demographics by Hearing Disability
Demographics Similar to Ethiopians by Hearing Disability
In terms of hearing disability, the demographic groups most similar to Ethiopians are Immigrants from Eastern Asia (2.7%, a difference of 0.030%), Immigrants from Ethiopia (2.7%, a difference of 0.060%), Immigrants from Nicaragua (2.7%, a difference of 0.090%), Jamaican (2.7%, a difference of 0.10%), and South American (2.7%, a difference of 0.13%).
| Demographics | Rating | Rank | Hearing Disability |
| Immigrants | Israel | 99.3 /100 | #47 | Exceptional 2.6% |
| Immigrants | Singapore | 99.3 /100 | #48 | Exceptional 2.6% |
| Immigrants | South America | 99.2 /100 | #49 | Exceptional 2.7% |
| Paraguayans | 99.2 /100 | #50 | Exceptional 2.7% |
| Immigrants | Hong Kong | 99.2 /100 | #51 | Exceptional 2.7% |
| Jamaicans | 99.0 /100 | #52 | Exceptional 2.7% |
| Immigrants | Eastern Asia | 99.0 /100 | #53 | Exceptional 2.7% |
| Ethiopians | 99.0 /100 | #54 | Exceptional 2.7% |
| Immigrants | Ethiopia | 99.0 /100 | #55 | Exceptional 2.7% |
| Immigrants | Nicaragua | 99.0 /100 | #56 | Exceptional 2.7% |
| South Americans | 99.0 /100 | #57 | Exceptional 2.7% |
| Immigrants | Peru | 98.6 /100 | #58 | Exceptional 2.7% |
| Immigrants | Eritrea | 98.5 /100 | #59 | Exceptional 2.7% |
| Immigrants | Egypt | 98.5 /100 | #60 | Exceptional 2.7% |
| Immigrants | Uzbekistan | 98.4 /100 | #61 | Exceptional 2.7% |
Demographics Similar to Immigrants from Middle Africa by Hearing Disability
In terms of hearing disability, the demographic groups most similar to Immigrants from Middle Africa are Iranian (2.8%, a difference of 0.030%), Immigrants from Morocco (2.8%, a difference of 0.080%), Belizean (2.8%, a difference of 0.11%), Immigrants from Turkey (2.8%, a difference of 0.13%), and Immigrants from Kuwait (2.8%, a difference of 0.15%).
| Demographics | Rating | Rank | Hearing Disability |
| Immigrants | Argentina | 97.0 /100 | #84 | Exceptional 2.8% |
| Immigrants | Northern Africa | 96.9 /100 | #85 | Exceptional 2.8% |
| Immigrants | Iran | 96.8 /100 | #86 | Exceptional 2.8% |
| Somalis | 96.7 /100 | #87 | Exceptional 2.8% |
| Immigrants | Turkey | 96.7 /100 | #88 | Exceptional 2.8% |
| Belizeans | 96.6 /100 | #89 | Exceptional 2.8% |
| Immigrants | Morocco | 96.6 /100 | #90 | Exceptional 2.8% |
| Immigrants | Middle Africa | 96.5 /100 | #91 | Exceptional 2.8% |
| Iranians | 96.4 /100 | #92 | Exceptional 2.8% |
| Immigrants | Kuwait | 96.3 /100 | #93 | Exceptional 2.8% |
| Uruguayans | 95.9 /100 | #94 | Exceptional 2.8% |
| Israelis | 95.9 /100 | #95 | Exceptional 2.8% |
| Immigrants | Somalia | 95.5 /100 | #96 | Exceptional 2.8% |
| Immigrants | Afghanistan | 95.3 /100 | #97 | Exceptional 2.8% |
| Immigrants | Honduras | 95.1 /100 | #98 | Exceptional 2.8% |