Ethiopian vs Immigrants from Venezuela Hearing Disability
COMPARE
Ethiopian
Immigrants from Venezuela
Hearing Disability
Hearing Disability Comparison
Ethiopians
Immigrants from Venezuela
2.7%
HEARING DISABILITY
99.0/ 100
METRIC RATING
54th/ 347
METRIC RANK
2.6%
HEARING DISABILITY
99.7/ 100
METRIC RATING
32nd/ 347
METRIC RANK
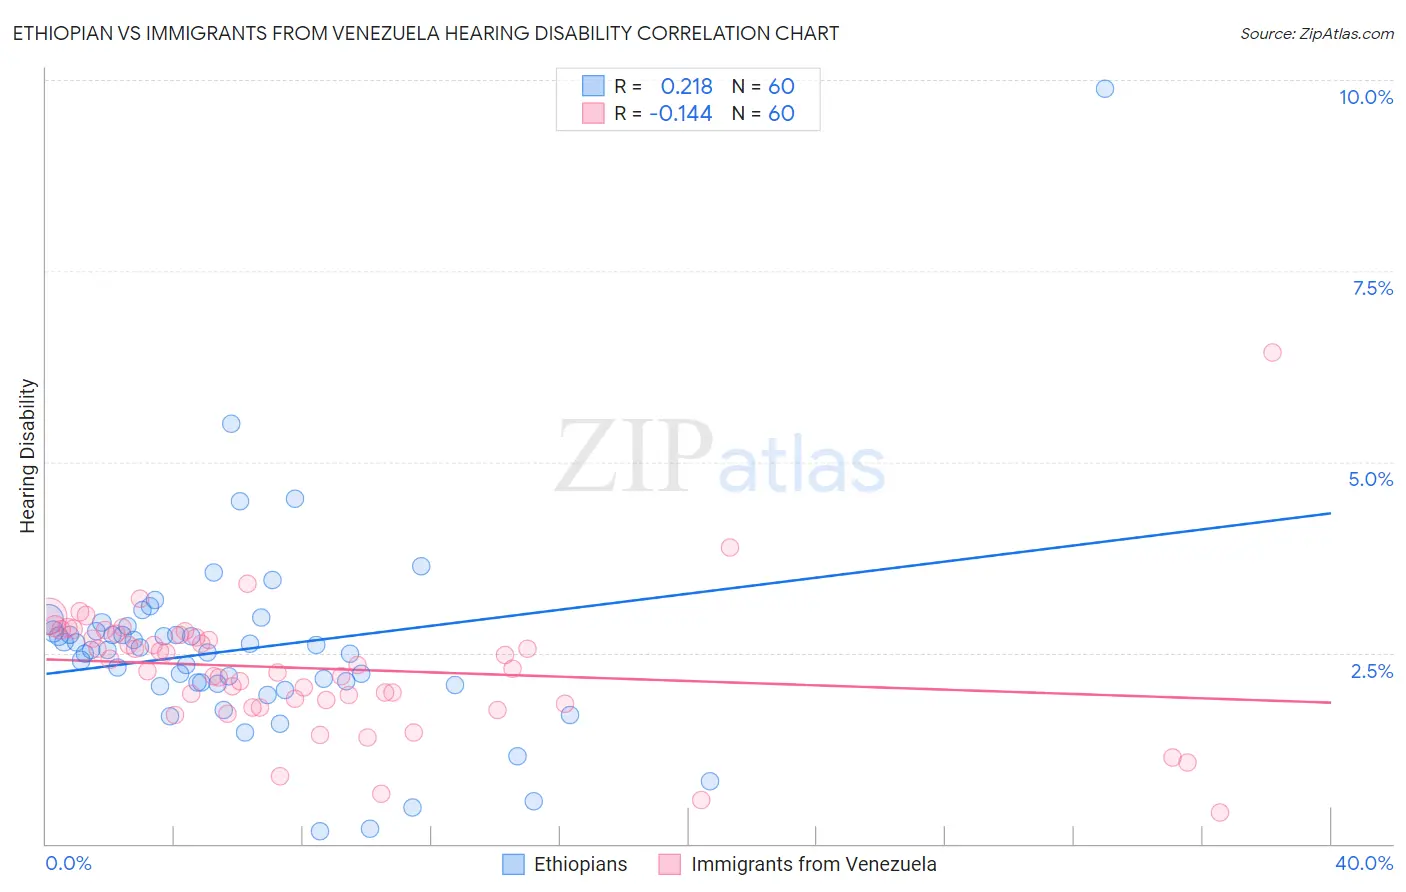
Ethiopian vs Immigrants from Venezuela Hearing Disability Correlation Chart
The statistical analysis conducted on geographies consisting of 223,190,203 people shows a weak positive correlation between the proportion of Ethiopians and percentage of population with hearing disability in the United States with a correlation coefficient (R) of 0.218 and weighted average of 2.7%. Similarly, the statistical analysis conducted on geographies consisting of 287,826,264 people shows a poor negative correlation between the proportion of Immigrants from Venezuela and percentage of population with hearing disability in the United States with a correlation coefficient (R) of -0.144 and weighted average of 2.6%, a difference of 2.9%.
Hearing Disability Correlation Summary
| Measurement | Ethiopian | Immigrants from Venezuela |
| Minimum | 0.17% | 0.40% |
| Maximum | 9.9% | 6.4% |
| Range | 9.7% | 6.0% |
| Mean | 2.5% | 2.3% |
| Median | 2.5% | 2.3% |
| Interquartile 25% (IQ1) | 2.1% | 1.9% |
| Interquartile 75% (IQ3) | 2.8% | 2.7% |
| Interquartile Range (IQR) | 0.70% | 0.89% |
| Standard Deviation (Sample) | 1.3% | 0.88% |
| Standard Deviation (Population) | 1.3% | 0.87% |
Similar Demographics by Hearing Disability
Demographics Similar to Ethiopians by Hearing Disability
In terms of hearing disability, the demographic groups most similar to Ethiopians are Immigrants from Eastern Asia (2.7%, a difference of 0.030%), Immigrants from Ethiopia (2.7%, a difference of 0.060%), Immigrants from Nicaragua (2.7%, a difference of 0.090%), Jamaican (2.7%, a difference of 0.10%), and South American (2.7%, a difference of 0.13%).
| Demographics | Rating | Rank | Hearing Disability |
| Immigrants | Israel | 99.3 /100 | #47 | Exceptional 2.6% |
| Immigrants | Singapore | 99.3 /100 | #48 | Exceptional 2.6% |
| Immigrants | South America | 99.2 /100 | #49 | Exceptional 2.7% |
| Paraguayans | 99.2 /100 | #50 | Exceptional 2.7% |
| Immigrants | Hong Kong | 99.2 /100 | #51 | Exceptional 2.7% |
| Jamaicans | 99.0 /100 | #52 | Exceptional 2.7% |
| Immigrants | Eastern Asia | 99.0 /100 | #53 | Exceptional 2.7% |
| Ethiopians | 99.0 /100 | #54 | Exceptional 2.7% |
| Immigrants | Ethiopia | 99.0 /100 | #55 | Exceptional 2.7% |
| Immigrants | Nicaragua | 99.0 /100 | #56 | Exceptional 2.7% |
| South Americans | 99.0 /100 | #57 | Exceptional 2.7% |
| Immigrants | Peru | 98.6 /100 | #58 | Exceptional 2.7% |
| Immigrants | Eritrea | 98.5 /100 | #59 | Exceptional 2.7% |
| Immigrants | Egypt | 98.5 /100 | #60 | Exceptional 2.7% |
| Immigrants | Uzbekistan | 98.4 /100 | #61 | Exceptional 2.7% |
Demographics Similar to Immigrants from Venezuela by Hearing Disability
In terms of hearing disability, the demographic groups most similar to Immigrants from Venezuela are Immigrants from Cameroon (2.6%, a difference of 0.14%), Immigrants from Caribbean (2.6%, a difference of 0.16%), Bolivian (2.6%, a difference of 0.23%), Immigrants from Haiti (2.6%, a difference of 0.26%), and Filipino (2.6%, a difference of 0.26%).
| Demographics | Rating | Rank | Hearing Disability |
| Immigrants | El Salvador | 99.7 /100 | #25 | Exceptional 2.6% |
| Immigrants | Senegal | 99.7 /100 | #26 | Exceptional 2.6% |
| Immigrants | South Central Asia | 99.7 /100 | #27 | Exceptional 2.6% |
| Immigrants | Haiti | 99.7 /100 | #28 | Exceptional 2.6% |
| Bolivians | 99.7 /100 | #29 | Exceptional 2.6% |
| Immigrants | Caribbean | 99.7 /100 | #30 | Exceptional 2.6% |
| Immigrants | Cameroon | 99.7 /100 | #31 | Exceptional 2.6% |
| Immigrants | Venezuela | 99.7 /100 | #32 | Exceptional 2.6% |
| Filipinos | 99.6 /100 | #33 | Exceptional 2.6% |
| Immigrants | Pakistan | 99.6 /100 | #34 | Exceptional 2.6% |
| Salvadorans | 99.6 /100 | #35 | Exceptional 2.6% |
| Okinawans | 99.6 /100 | #36 | Exceptional 2.6% |
| Immigrants | Western Africa | 99.6 /100 | #37 | Exceptional 2.6% |
| Immigrants | Jamaica | 99.5 /100 | #38 | Exceptional 2.6% |
| Immigrants | China | 99.5 /100 | #39 | Exceptional 2.6% |