Ethiopian vs Blackfeet Hearing Disability
COMPARE
Ethiopian
Blackfeet
Hearing Disability
Hearing Disability Comparison
Ethiopians
Blackfeet
2.7%
HEARING DISABILITY
99.0/ 100
METRIC RATING
54th/ 347
METRIC RANK
3.6%
HEARING DISABILITY
0.0/ 100
METRIC RATING
283rd/ 347
METRIC RANK
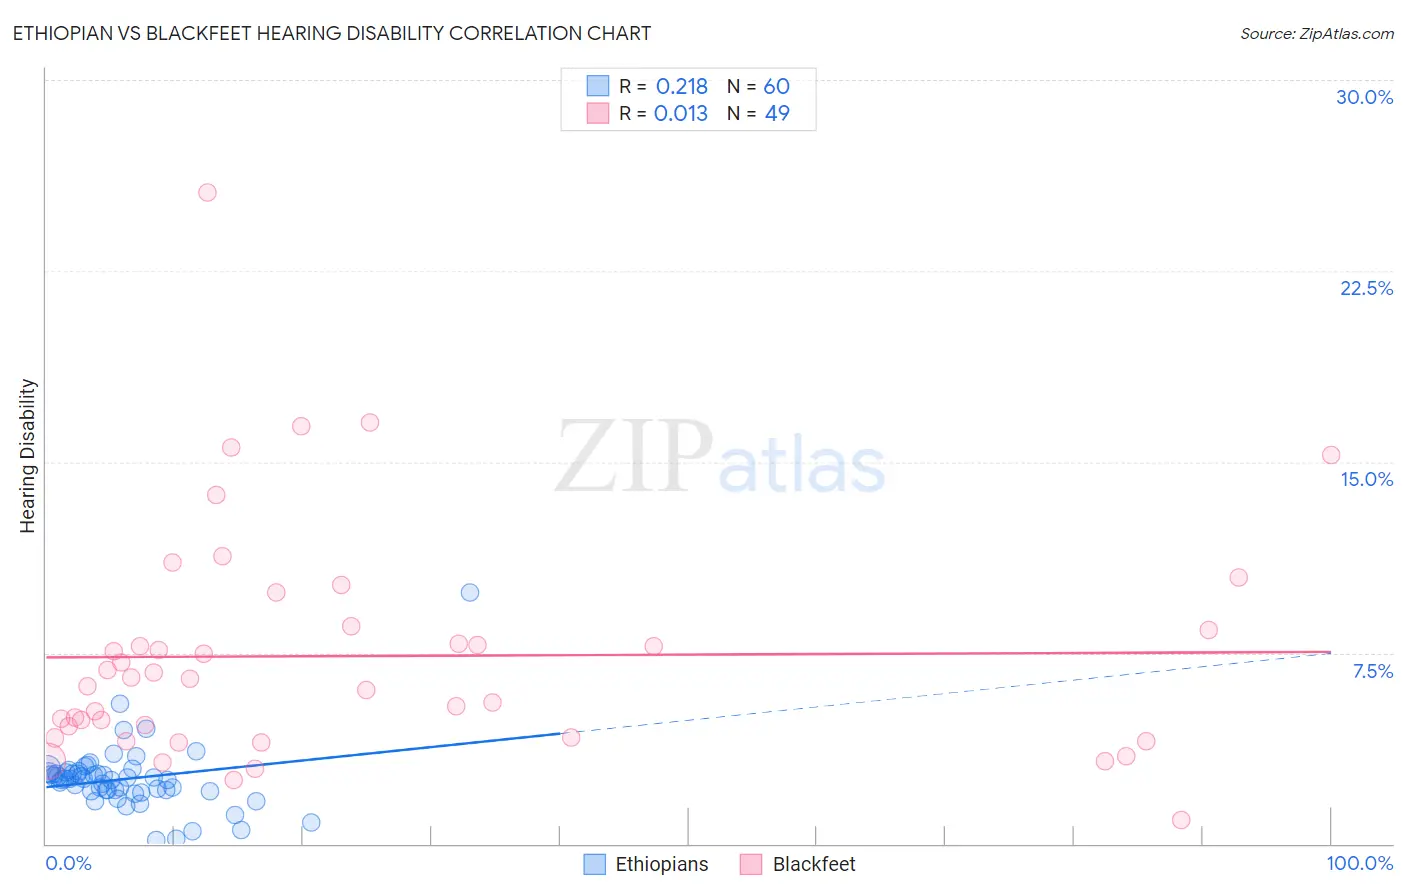
Ethiopian vs Blackfeet Hearing Disability Correlation Chart
The statistical analysis conducted on geographies consisting of 223,190,203 people shows a weak positive correlation between the proportion of Ethiopians and percentage of population with hearing disability in the United States with a correlation coefficient (R) of 0.218 and weighted average of 2.7%. Similarly, the statistical analysis conducted on geographies consisting of 309,445,553 people shows no correlation between the proportion of Blackfeet and percentage of population with hearing disability in the United States with a correlation coefficient (R) of 0.013 and weighted average of 3.6%, a difference of 35.5%.
Hearing Disability Correlation Summary
| Measurement | Ethiopian | Blackfeet |
| Minimum | 0.17% | 0.91% |
| Maximum | 9.9% | 25.6% |
| Range | 9.7% | 24.7% |
| Mean | 2.5% | 7.4% |
| Median | 2.5% | 6.5% |
| Interquartile 25% (IQ1) | 2.1% | 4.2% |
| Interquartile 75% (IQ3) | 2.8% | 8.5% |
| Interquartile Range (IQR) | 0.70% | 4.3% |
| Standard Deviation (Sample) | 1.3% | 4.6% |
| Standard Deviation (Population) | 1.3% | 4.5% |
Similar Demographics by Hearing Disability
Demographics Similar to Ethiopians by Hearing Disability
In terms of hearing disability, the demographic groups most similar to Ethiopians are Immigrants from Eastern Asia (2.7%, a difference of 0.030%), Immigrants from Ethiopia (2.7%, a difference of 0.060%), Immigrants from Nicaragua (2.7%, a difference of 0.090%), Jamaican (2.7%, a difference of 0.10%), and South American (2.7%, a difference of 0.13%).
| Demographics | Rating | Rank | Hearing Disability |
| Immigrants | Israel | 99.3 /100 | #47 | Exceptional 2.6% |
| Immigrants | Singapore | 99.3 /100 | #48 | Exceptional 2.6% |
| Immigrants | South America | 99.2 /100 | #49 | Exceptional 2.7% |
| Paraguayans | 99.2 /100 | #50 | Exceptional 2.7% |
| Immigrants | Hong Kong | 99.2 /100 | #51 | Exceptional 2.7% |
| Jamaicans | 99.0 /100 | #52 | Exceptional 2.7% |
| Immigrants | Eastern Asia | 99.0 /100 | #53 | Exceptional 2.7% |
| Ethiopians | 99.0 /100 | #54 | Exceptional 2.7% |
| Immigrants | Ethiopia | 99.0 /100 | #55 | Exceptional 2.7% |
| Immigrants | Nicaragua | 99.0 /100 | #56 | Exceptional 2.7% |
| South Americans | 99.0 /100 | #57 | Exceptional 2.7% |
| Immigrants | Peru | 98.6 /100 | #58 | Exceptional 2.7% |
| Immigrants | Eritrea | 98.5 /100 | #59 | Exceptional 2.7% |
| Immigrants | Egypt | 98.5 /100 | #60 | Exceptional 2.7% |
| Immigrants | Uzbekistan | 98.4 /100 | #61 | Exceptional 2.7% |
Demographics Similar to Blackfeet by Hearing Disability
In terms of hearing disability, the demographic groups most similar to Blackfeet are Swedish (3.6%, a difference of 0.25%), Scandinavian (3.6%, a difference of 0.34%), French American Indian (3.6%, a difference of 0.40%), Slovak (3.6%, a difference of 0.46%), and Immigrants from Micronesia (3.6%, a difference of 0.47%).
| Demographics | Rating | Rank | Hearing Disability |
| Danes | 0.0 /100 | #276 | Tragic 3.6% |
| Immigrants | Nonimmigrants | 0.0 /100 | #277 | Tragic 3.6% |
| Basques | 0.0 /100 | #278 | Tragic 3.6% |
| Slovaks | 0.0 /100 | #279 | Tragic 3.6% |
| French American Indians | 0.0 /100 | #280 | Tragic 3.6% |
| Scandinavians | 0.0 /100 | #281 | Tragic 3.6% |
| Swedes | 0.0 /100 | #282 | Tragic 3.6% |
| Blackfeet | 0.0 /100 | #283 | Tragic 3.6% |
| Immigrants | Micronesia | 0.0 /100 | #284 | Tragic 3.6% |
| Sioux | 0.0 /100 | #285 | Tragic 3.6% |
| Delaware | 0.0 /100 | #286 | Tragic 3.6% |
| Spanish | 0.0 /100 | #287 | Tragic 3.7% |
| Irish | 0.0 /100 | #288 | Tragic 3.7% |
| Chinese | 0.0 /100 | #289 | Tragic 3.7% |
| Whites/Caucasians | 0.0 /100 | #290 | Tragic 3.7% |