Ethiopian vs Spaniard Hearing Disability
COMPARE
Ethiopian
Spaniard
Hearing Disability
Hearing Disability Comparison
Ethiopians
Spaniards
2.7%
HEARING DISABILITY
99.0/ 100
METRIC RATING
54th/ 347
METRIC RANK
3.5%
HEARING DISABILITY
0.1/ 100
METRIC RATING
268th/ 347
METRIC RANK
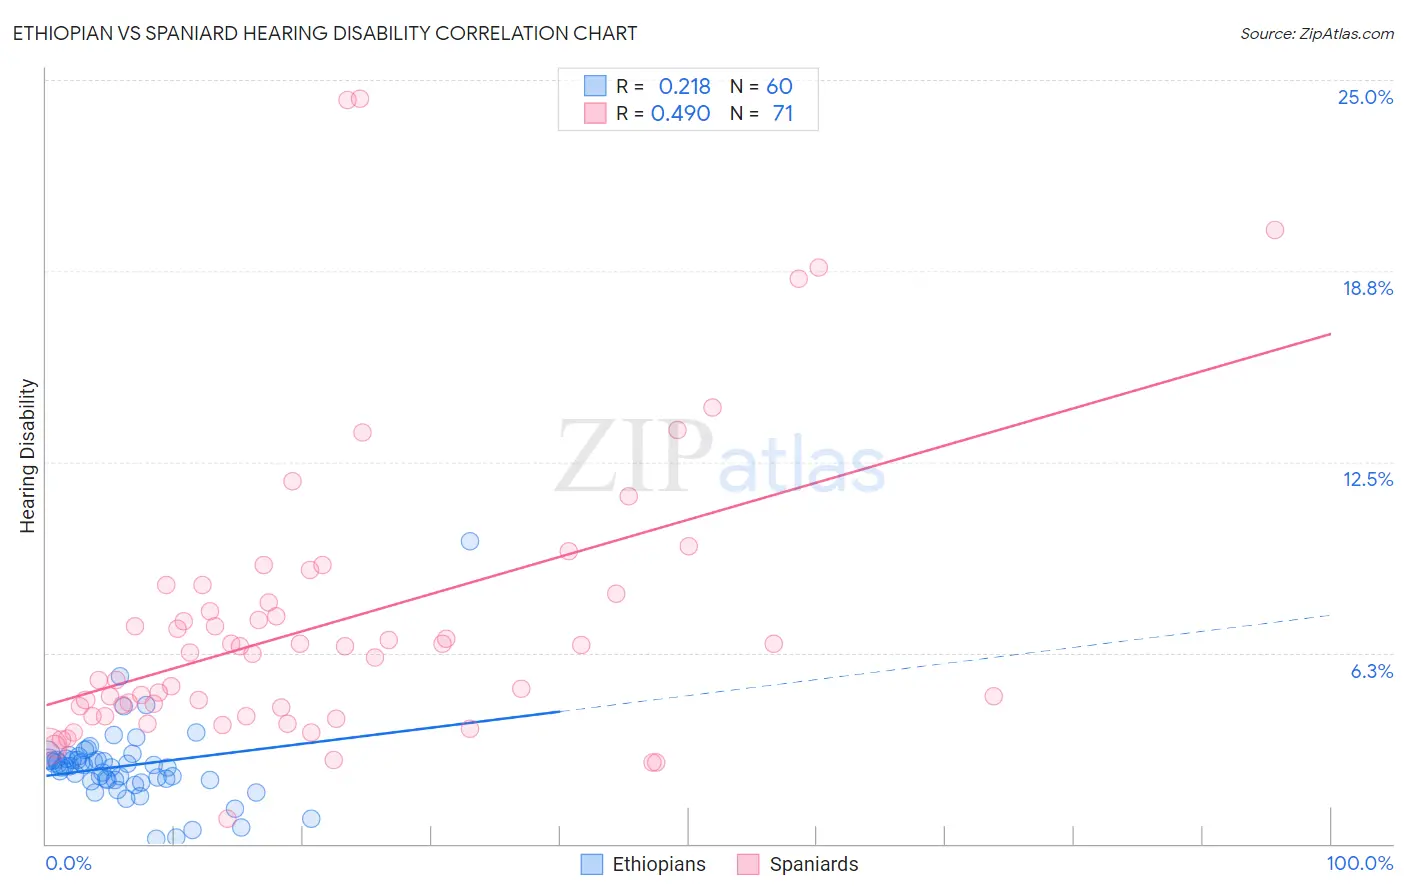
Ethiopian vs Spaniard Hearing Disability Correlation Chart
The statistical analysis conducted on geographies consisting of 223,190,203 people shows a weak positive correlation between the proportion of Ethiopians and percentage of population with hearing disability in the United States with a correlation coefficient (R) of 0.218 and weighted average of 2.7%. Similarly, the statistical analysis conducted on geographies consisting of 443,274,447 people shows a moderate positive correlation between the proportion of Spaniards and percentage of population with hearing disability in the United States with a correlation coefficient (R) of 0.490 and weighted average of 3.5%, a difference of 30.6%.
Hearing Disability Correlation Summary
| Measurement | Ethiopian | Spaniard |
| Minimum | 0.17% | 0.81% |
| Maximum | 9.9% | 24.4% |
| Range | 9.7% | 23.6% |
| Mean | 2.5% | 7.2% |
| Median | 2.5% | 6.2% |
| Interquartile 25% (IQ1) | 2.1% | 4.2% |
| Interquartile 75% (IQ3) | 2.8% | 8.2% |
| Interquartile Range (IQR) | 0.70% | 4.0% |
| Standard Deviation (Sample) | 1.3% | 4.7% |
| Standard Deviation (Population) | 1.3% | 4.7% |
Similar Demographics by Hearing Disability
Demographics Similar to Ethiopians by Hearing Disability
In terms of hearing disability, the demographic groups most similar to Ethiopians are Immigrants from Eastern Asia (2.7%, a difference of 0.030%), Immigrants from Ethiopia (2.7%, a difference of 0.060%), Immigrants from Nicaragua (2.7%, a difference of 0.090%), Jamaican (2.7%, a difference of 0.10%), and South American (2.7%, a difference of 0.13%).
| Demographics | Rating | Rank | Hearing Disability |
| Immigrants | Israel | 99.3 /100 | #47 | Exceptional 2.6% |
| Immigrants | Singapore | 99.3 /100 | #48 | Exceptional 2.6% |
| Immigrants | South America | 99.2 /100 | #49 | Exceptional 2.7% |
| Paraguayans | 99.2 /100 | #50 | Exceptional 2.7% |
| Immigrants | Hong Kong | 99.2 /100 | #51 | Exceptional 2.7% |
| Jamaicans | 99.0 /100 | #52 | Exceptional 2.7% |
| Immigrants | Eastern Asia | 99.0 /100 | #53 | Exceptional 2.7% |
| Ethiopians | 99.0 /100 | #54 | Exceptional 2.7% |
| Immigrants | Ethiopia | 99.0 /100 | #55 | Exceptional 2.7% |
| Immigrants | Nicaragua | 99.0 /100 | #56 | Exceptional 2.7% |
| South Americans | 99.0 /100 | #57 | Exceptional 2.7% |
| Immigrants | Peru | 98.6 /100 | #58 | Exceptional 2.7% |
| Immigrants | Eritrea | 98.5 /100 | #59 | Exceptional 2.7% |
| Immigrants | Egypt | 98.5 /100 | #60 | Exceptional 2.7% |
| Immigrants | Uzbekistan | 98.4 /100 | #61 | Exceptional 2.7% |
Demographics Similar to Spaniards by Hearing Disability
In terms of hearing disability, the demographic groups most similar to Spaniards are Canadian (3.5%, a difference of 0.020%), Belgian (3.5%, a difference of 0.24%), Ute (3.5%, a difference of 0.30%), British (3.5%, a difference of 0.42%), and Immigrants from Germany (3.5%, a difference of 0.44%).
| Demographics | Rating | Rank | Hearing Disability |
| Hawaiians | 0.1 /100 | #261 | Tragic 3.5% |
| Immigrants | North America | 0.1 /100 | #262 | Tragic 3.5% |
| Immigrants | Canada | 0.1 /100 | #263 | Tragic 3.5% |
| Immigrants | Germany | 0.1 /100 | #264 | Tragic 3.5% |
| British | 0.1 /100 | #265 | Tragic 3.5% |
| Belgians | 0.1 /100 | #266 | Tragic 3.5% |
| Canadians | 0.1 /100 | #267 | Tragic 3.5% |
| Spaniards | 0.1 /100 | #268 | Tragic 3.5% |
| Ute | 0.1 /100 | #269 | Tragic 3.5% |
| Europeans | 0.1 /100 | #270 | Tragic 3.5% |
| Czechs | 0.1 /100 | #271 | Tragic 3.5% |
| Fijians | 0.0 /100 | #272 | Tragic 3.5% |
| Puerto Ricans | 0.0 /100 | #273 | Tragic 3.5% |
| Swiss | 0.0 /100 | #274 | Tragic 3.5% |
| Czechoslovakians | 0.0 /100 | #275 | Tragic 3.6% |