Dutch vs Immigrants from Spain Vision Disability
COMPARE
Dutch
Immigrants from Spain
Vision Disability
Vision Disability Comparison
Dutch
Immigrants from Spain
2.2%
VISION DISABILITY
17.1/ 100
METRIC RATING
203rd/ 347
METRIC RANK
2.1%
VISION DISABILITY
89.8/ 100
METRIC RATING
124th/ 347
METRIC RANK
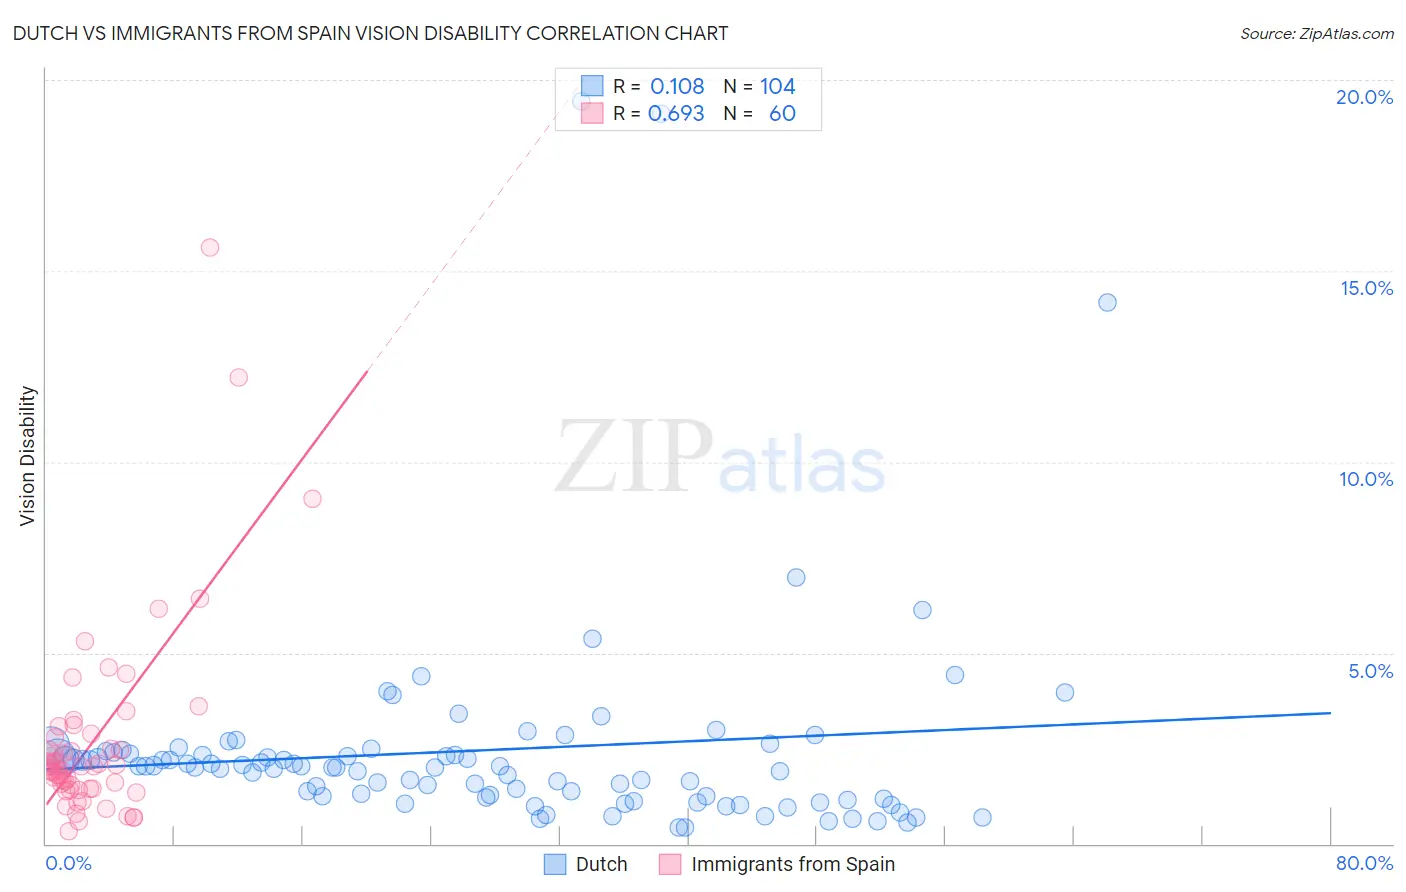
Dutch vs Immigrants from Spain Vision Disability Correlation Chart
The statistical analysis conducted on geographies consisting of 552,767,412 people shows a poor positive correlation between the proportion of Dutch and percentage of population with vision disability in the United States with a correlation coefficient (R) of 0.108 and weighted average of 2.2%. Similarly, the statistical analysis conducted on geographies consisting of 239,518,838 people shows a significant positive correlation between the proportion of Immigrants from Spain and percentage of population with vision disability in the United States with a correlation coefficient (R) of 0.693 and weighted average of 2.1%, a difference of 6.1%.
Vision Disability Correlation Summary
| Measurement | Dutch | Immigrants from Spain |
| Minimum | 0.42% | 0.32% |
| Maximum | 19.4% | 15.6% |
| Range | 19.0% | 15.3% |
| Mean | 2.4% | 2.7% |
| Median | 2.0% | 2.0% |
| Interquartile 25% (IQ1) | 1.2% | 1.4% |
| Interquartile 75% (IQ3) | 2.4% | 2.8% |
| Interquartile Range (IQR) | 1.2% | 1.4% |
| Standard Deviation (Sample) | 2.9% | 2.6% |
| Standard Deviation (Population) | 2.9% | 2.6% |
Similar Demographics by Vision Disability
Demographics Similar to Dutch by Vision Disability
In terms of vision disability, the demographic groups most similar to Dutch are Immigrants from Zaire (2.2%, a difference of 0.10%), Immigrants from Guyana (2.2%, a difference of 0.13%), Samoan (2.2%, a difference of 0.16%), Slovak (2.2%, a difference of 0.18%), and Pennsylvania German (2.2%, a difference of 0.30%).
| Demographics | Rating | Rank | Vision Disability |
| Immigrants | Grenada | 23.1 /100 | #196 | Fair 2.2% |
| Ghanaians | 21.8 /100 | #197 | Fair 2.2% |
| Czechoslovakians | 21.6 /100 | #198 | Fair 2.2% |
| Immigrants | El Salvador | 21.0 /100 | #199 | Fair 2.2% |
| Immigrants | Thailand | 20.1 /100 | #200 | Fair 2.2% |
| Slovaks | 18.8 /100 | #201 | Poor 2.2% |
| Immigrants | Zaire | 18.0 /100 | #202 | Poor 2.2% |
| Dutch | 17.1 /100 | #203 | Poor 2.2% |
| Immigrants | Guyana | 15.9 /100 | #204 | Poor 2.2% |
| Samoans | 15.7 /100 | #205 | Poor 2.2% |
| Pennsylvania Germans | 14.5 /100 | #206 | Poor 2.2% |
| Immigrants | Nigeria | 13.5 /100 | #207 | Poor 2.2% |
| Germans | 13.4 /100 | #208 | Poor 2.2% |
| Immigrants | Brazil | 13.1 /100 | #209 | Poor 2.2% |
| Immigrants | Uruguay | 11.5 /100 | #210 | Poor 2.2% |
Demographics Similar to Immigrants from Spain by Vision Disability
In terms of vision disability, the demographic groups most similar to Immigrants from Spain are Immigrants from Venezuela (2.1%, a difference of 0.0%), Immigrants from Peru (2.1%, a difference of 0.040%), Immigrants from Scotland (2.1%, a difference of 0.11%), Immigrants from Ukraine (2.1%, a difference of 0.11%), and Immigrants from Albania (2.1%, a difference of 0.11%).
| Demographics | Rating | Rank | Vision Disability |
| Poles | 92.0 /100 | #117 | Exceptional 2.1% |
| Immigrants | Philippines | 91.4 /100 | #118 | Exceptional 2.1% |
| Immigrants | Uganda | 91.4 /100 | #119 | Exceptional 2.1% |
| Immigrants | Zimbabwe | 91.0 /100 | #120 | Exceptional 2.1% |
| Immigrants | Scotland | 90.4 /100 | #121 | Exceptional 2.1% |
| Immigrants | Ukraine | 90.4 /100 | #122 | Exceptional 2.1% |
| Immigrants | Albania | 90.4 /100 | #123 | Exceptional 2.1% |
| Immigrants | Spain | 89.8 /100 | #124 | Excellent 2.1% |
| Immigrants | Venezuela | 89.8 /100 | #125 | Excellent 2.1% |
| Immigrants | Peru | 89.5 /100 | #126 | Excellent 2.1% |
| Sudanese | 89.2 /100 | #127 | Excellent 2.1% |
| Immigrants | Chile | 89.0 /100 | #128 | Excellent 2.1% |
| Immigrants | Cameroon | 88.8 /100 | #129 | Excellent 2.1% |
| Immigrants | Kenya | 88.7 /100 | #130 | Excellent 2.1% |
| Immigrants | Hungary | 88.7 /100 | #131 | Excellent 2.1% |