Dutch vs Immigrants from Europe Vision Disability
COMPARE
Dutch
Immigrants from Europe
Vision Disability
Vision Disability Comparison
Dutch
Immigrants from Europe
2.2%
VISION DISABILITY
17.1/ 100
METRIC RATING
203rd/ 347
METRIC RANK
2.1%
VISION DISABILITY
96.1/ 100
METRIC RATING
93rd/ 347
METRIC RANK
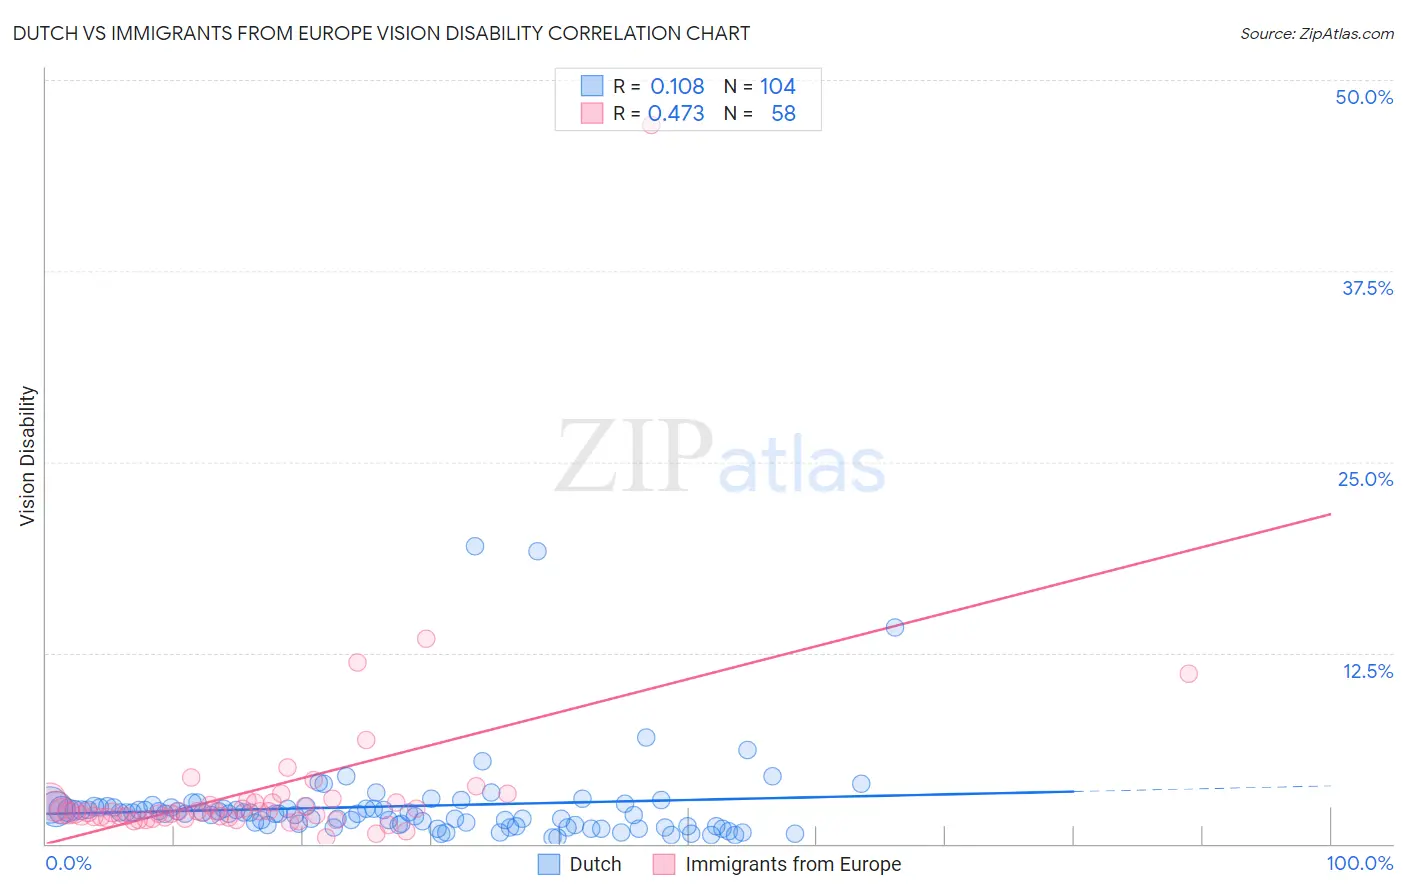
Dutch vs Immigrants from Europe Vision Disability Correlation Chart
The statistical analysis conducted on geographies consisting of 552,767,412 people shows a poor positive correlation between the proportion of Dutch and percentage of population with vision disability in the United States with a correlation coefficient (R) of 0.108 and weighted average of 2.2%. Similarly, the statistical analysis conducted on geographies consisting of 546,008,895 people shows a moderate positive correlation between the proportion of Immigrants from Europe and percentage of population with vision disability in the United States with a correlation coefficient (R) of 0.473 and weighted average of 2.1%, a difference of 7.9%.
Vision Disability Correlation Summary
| Measurement | Dutch | Immigrants from Europe |
| Minimum | 0.42% | 0.41% |
| Maximum | 19.4% | 47.1% |
| Range | 19.0% | 46.7% |
| Mean | 2.4% | 3.5% |
| Median | 2.0% | 2.1% |
| Interquartile 25% (IQ1) | 1.2% | 1.7% |
| Interquartile 75% (IQ3) | 2.4% | 2.7% |
| Interquartile Range (IQR) | 1.2% | 1.0% |
| Standard Deviation (Sample) | 2.9% | 6.3% |
| Standard Deviation (Population) | 2.9% | 6.3% |
Similar Demographics by Vision Disability
Demographics Similar to Dutch by Vision Disability
In terms of vision disability, the demographic groups most similar to Dutch are Immigrants from Zaire (2.2%, a difference of 0.10%), Immigrants from Guyana (2.2%, a difference of 0.13%), Samoan (2.2%, a difference of 0.16%), Slovak (2.2%, a difference of 0.18%), and Pennsylvania German (2.2%, a difference of 0.30%).
| Demographics | Rating | Rank | Vision Disability |
| Immigrants | Grenada | 23.1 /100 | #196 | Fair 2.2% |
| Ghanaians | 21.8 /100 | #197 | Fair 2.2% |
| Czechoslovakians | 21.6 /100 | #198 | Fair 2.2% |
| Immigrants | El Salvador | 21.0 /100 | #199 | Fair 2.2% |
| Immigrants | Thailand | 20.1 /100 | #200 | Fair 2.2% |
| Slovaks | 18.8 /100 | #201 | Poor 2.2% |
| Immigrants | Zaire | 18.0 /100 | #202 | Poor 2.2% |
| Dutch | 17.1 /100 | #203 | Poor 2.2% |
| Immigrants | Guyana | 15.9 /100 | #204 | Poor 2.2% |
| Samoans | 15.7 /100 | #205 | Poor 2.2% |
| Pennsylvania Germans | 14.5 /100 | #206 | Poor 2.2% |
| Immigrants | Nigeria | 13.5 /100 | #207 | Poor 2.2% |
| Germans | 13.4 /100 | #208 | Poor 2.2% |
| Immigrants | Brazil | 13.1 /100 | #209 | Poor 2.2% |
| Immigrants | Uruguay | 11.5 /100 | #210 | Poor 2.2% |
Demographics Similar to Immigrants from Europe by Vision Disability
In terms of vision disability, the demographic groups most similar to Immigrants from Europe are Immigrants from Croatia (2.1%, a difference of 0.020%), Immigrants from Syria (2.1%, a difference of 0.050%), Immigrants from Somalia (2.1%, a difference of 0.060%), Australian (2.1%, a difference of 0.090%), and Romanian (2.1%, a difference of 0.15%).
| Demographics | Rating | Rank | Vision Disability |
| Immigrants | Moldova | 97.2 /100 | #86 | Exceptional 2.0% |
| Immigrants | Switzerland | 97.0 /100 | #87 | Exceptional 2.0% |
| Norwegians | 97.0 /100 | #88 | Exceptional 2.0% |
| Immigrants | Eastern Africa | 97.0 /100 | #89 | Exceptional 2.0% |
| Immigrants | Lebanon | 96.7 /100 | #90 | Exceptional 2.1% |
| Immigrants | Somalia | 96.2 /100 | #91 | Exceptional 2.1% |
| Immigrants | Syria | 96.2 /100 | #92 | Exceptional 2.1% |
| Immigrants | Europe | 96.1 /100 | #93 | Exceptional 2.1% |
| Immigrants | Croatia | 96.0 /100 | #94 | Exceptional 2.1% |
| Australians | 95.9 /100 | #95 | Exceptional 2.1% |
| Romanians | 95.7 /100 | #96 | Exceptional 2.1% |
| Immigrants | Afghanistan | 95.6 /100 | #97 | Exceptional 2.1% |
| Immigrants | South Africa | 95.4 /100 | #98 | Exceptional 2.1% |
| Estonians | 95.3 /100 | #99 | Exceptional 2.1% |
| Greeks | 95.1 /100 | #100 | Exceptional 2.1% |