Dutch vs British Vision Disability
COMPARE
Dutch
British
Vision Disability
Vision Disability Comparison
Dutch
British
2.2%
VISION DISABILITY
17.1/ 100
METRIC RATING
203rd/ 347
METRIC RANK
2.2%
VISION DISABILITY
25.1/ 100
METRIC RATING
193rd/ 347
METRIC RANK
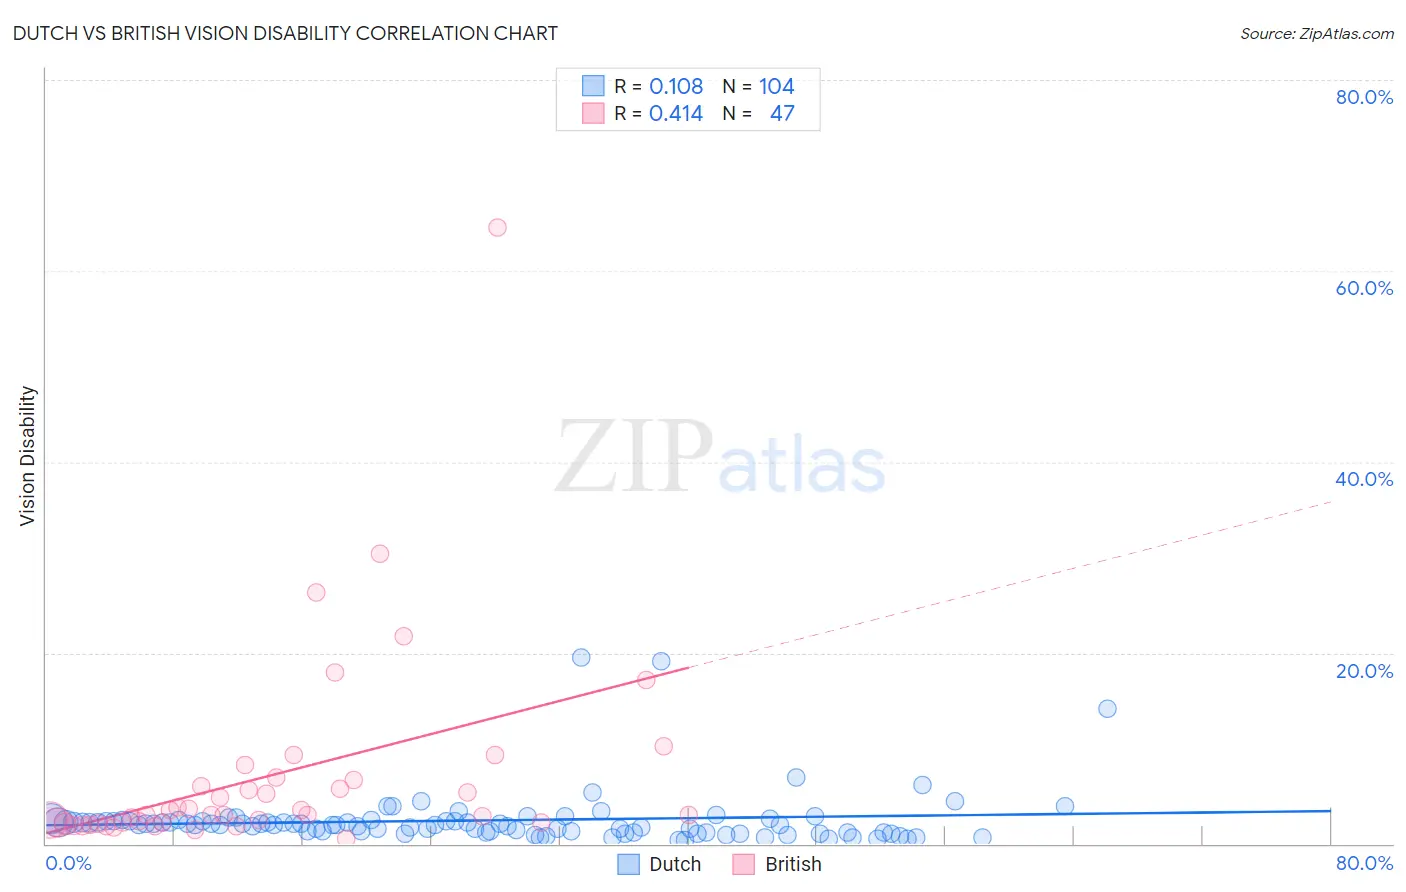
Dutch vs British Vision Disability Correlation Chart
The statistical analysis conducted on geographies consisting of 552,767,412 people shows a poor positive correlation between the proportion of Dutch and percentage of population with vision disability in the United States with a correlation coefficient (R) of 0.108 and weighted average of 2.2%. Similarly, the statistical analysis conducted on geographies consisting of 530,471,861 people shows a moderate positive correlation between the proportion of British and percentage of population with vision disability in the United States with a correlation coefficient (R) of 0.414 and weighted average of 2.2%, a difference of 0.75%.
Vision Disability Correlation Summary
| Measurement | Dutch | British |
| Minimum | 0.42% | 0.53% |
| Maximum | 19.4% | 64.6% |
| Range | 19.0% | 64.1% |
| Mean | 2.4% | 7.1% |
| Median | 2.0% | 3.0% |
| Interquartile 25% (IQ1) | 1.2% | 2.2% |
| Interquartile 75% (IQ3) | 2.4% | 6.6% |
| Interquartile Range (IQR) | 1.2% | 4.5% |
| Standard Deviation (Sample) | 2.9% | 10.8% |
| Standard Deviation (Population) | 2.9% | 10.7% |
Demographics Similar to Dutch and British by Vision Disability
In terms of vision disability, the demographic groups most similar to Dutch are Immigrants from Zaire (2.2%, a difference of 0.10%), Immigrants from Guyana (2.2%, a difference of 0.13%), Samoan (2.2%, a difference of 0.16%), Slovak (2.2%, a difference of 0.18%), and Pennsylvania German (2.2%, a difference of 0.30%). Similarly, the demographic groups most similar to British are European (2.2%, a difference of 0.050%), Canadian (2.2%, a difference of 0.060%), Immigrants from Costa Rica (2.2%, a difference of 0.080%), Immigrants from Barbados (2.2%, a difference of 0.090%), and Immigrants (2.2%, a difference of 0.11%).
| Demographics | Rating | Rank | Vision Disability |
| Guyanese | 28.9 /100 | #188 | Fair 2.2% |
| Salvadorans | 27.4 /100 | #189 | Fair 2.2% |
| Immigrants | Costa Rica | 26.1 /100 | #190 | Fair 2.2% |
| Canadians | 25.8 /100 | #191 | Fair 2.2% |
| Europeans | 25.7 /100 | #192 | Fair 2.2% |
| British | 25.1 /100 | #193 | Fair 2.2% |
| Immigrants | Barbados | 24.0 /100 | #194 | Fair 2.2% |
| Immigrants | Immigrants | 23.7 /100 | #195 | Fair 2.2% |
| Immigrants | Grenada | 23.1 /100 | #196 | Fair 2.2% |
| Ghanaians | 21.8 /100 | #197 | Fair 2.2% |
| Czechoslovakians | 21.6 /100 | #198 | Fair 2.2% |
| Immigrants | El Salvador | 21.0 /100 | #199 | Fair 2.2% |
| Immigrants | Thailand | 20.1 /100 | #200 | Fair 2.2% |
| Slovaks | 18.8 /100 | #201 | Poor 2.2% |
| Immigrants | Zaire | 18.0 /100 | #202 | Poor 2.2% |
| Dutch | 17.1 /100 | #203 | Poor 2.2% |
| Immigrants | Guyana | 15.9 /100 | #204 | Poor 2.2% |
| Samoans | 15.7 /100 | #205 | Poor 2.2% |
| Pennsylvania Germans | 14.5 /100 | #206 | Poor 2.2% |
| Immigrants | Nigeria | 13.5 /100 | #207 | Poor 2.2% |
| Germans | 13.4 /100 | #208 | Poor 2.2% |