Dutch vs Immigrants from Turkey Vision Disability
COMPARE
Dutch
Immigrants from Turkey
Vision Disability
Vision Disability Comparison
Dutch
Immigrants from Turkey
2.2%
VISION DISABILITY
17.1/ 100
METRIC RATING
203rd/ 347
METRIC RANK
1.9%
VISION DISABILITY
99.8/ 100
METRIC RATING
34th/ 347
METRIC RANK
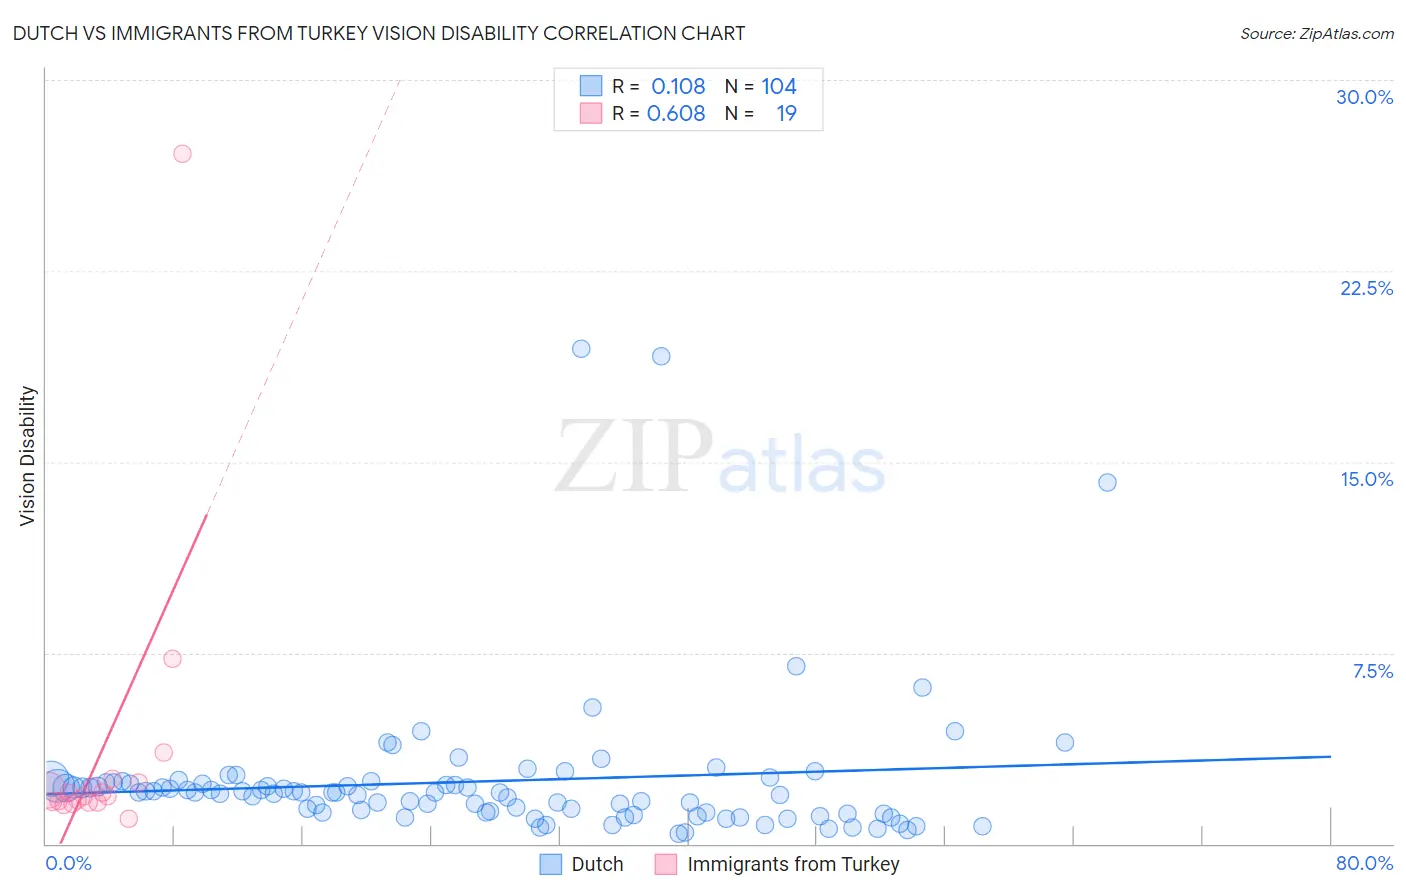
Dutch vs Immigrants from Turkey Vision Disability Correlation Chart
The statistical analysis conducted on geographies consisting of 552,767,412 people shows a poor positive correlation between the proportion of Dutch and percentage of population with vision disability in the United States with a correlation coefficient (R) of 0.108 and weighted average of 2.2%. Similarly, the statistical analysis conducted on geographies consisting of 222,977,745 people shows a significant positive correlation between the proportion of Immigrants from Turkey and percentage of population with vision disability in the United States with a correlation coefficient (R) of 0.608 and weighted average of 1.9%, a difference of 14.0%.
Vision Disability Correlation Summary
| Measurement | Dutch | Immigrants from Turkey |
| Minimum | 0.42% | 0.99% |
| Maximum | 19.4% | 27.1% |
| Range | 19.0% | 26.1% |
| Mean | 2.4% | 3.6% |
| Median | 2.0% | 1.8% |
| Interquartile 25% (IQ1) | 1.2% | 1.6% |
| Interquartile 75% (IQ3) | 2.4% | 2.4% |
| Interquartile Range (IQR) | 1.2% | 0.80% |
| Standard Deviation (Sample) | 2.9% | 5.9% |
| Standard Deviation (Population) | 2.9% | 5.7% |
Similar Demographics by Vision Disability
Demographics Similar to Dutch by Vision Disability
In terms of vision disability, the demographic groups most similar to Dutch are Immigrants from Zaire (2.2%, a difference of 0.10%), Immigrants from Guyana (2.2%, a difference of 0.13%), Samoan (2.2%, a difference of 0.16%), Slovak (2.2%, a difference of 0.18%), and Pennsylvania German (2.2%, a difference of 0.30%).
| Demographics | Rating | Rank | Vision Disability |
| Immigrants | Grenada | 23.1 /100 | #196 | Fair 2.2% |
| Ghanaians | 21.8 /100 | #197 | Fair 2.2% |
| Czechoslovakians | 21.6 /100 | #198 | Fair 2.2% |
| Immigrants | El Salvador | 21.0 /100 | #199 | Fair 2.2% |
| Immigrants | Thailand | 20.1 /100 | #200 | Fair 2.2% |
| Slovaks | 18.8 /100 | #201 | Poor 2.2% |
| Immigrants | Zaire | 18.0 /100 | #202 | Poor 2.2% |
| Dutch | 17.1 /100 | #203 | Poor 2.2% |
| Immigrants | Guyana | 15.9 /100 | #204 | Poor 2.2% |
| Samoans | 15.7 /100 | #205 | Poor 2.2% |
| Pennsylvania Germans | 14.5 /100 | #206 | Poor 2.2% |
| Immigrants | Nigeria | 13.5 /100 | #207 | Poor 2.2% |
| Germans | 13.4 /100 | #208 | Poor 2.2% |
| Immigrants | Brazil | 13.1 /100 | #209 | Poor 2.2% |
| Immigrants | Uruguay | 11.5 /100 | #210 | Poor 2.2% |
Demographics Similar to Immigrants from Turkey by Vision Disability
In terms of vision disability, the demographic groups most similar to Immigrants from Turkey are Immigrants from Australia (1.9%, a difference of 0.10%), Immigrants from Egypt (1.9%, a difference of 0.13%), Luxembourger (1.9%, a difference of 0.43%), Cambodian (2.0%, a difference of 0.44%), and Bhutanese (2.0%, a difference of 0.69%).
| Demographics | Rating | Rank | Vision Disability |
| Taiwanese | 99.9 /100 | #27 | Exceptional 1.9% |
| Immigrants | Malaysia | 99.9 /100 | #28 | Exceptional 1.9% |
| Egyptians | 99.9 /100 | #29 | Exceptional 1.9% |
| Immigrants | Nepal | 99.9 /100 | #30 | Exceptional 1.9% |
| Mongolians | 99.9 /100 | #31 | Exceptional 1.9% |
| Luxembourgers | 99.9 /100 | #32 | Exceptional 1.9% |
| Immigrants | Egypt | 99.9 /100 | #33 | Exceptional 1.9% |
| Immigrants | Turkey | 99.8 /100 | #34 | Exceptional 1.9% |
| Immigrants | Australia | 99.8 /100 | #35 | Exceptional 1.9% |
| Cambodians | 99.8 /100 | #36 | Exceptional 2.0% |
| Bhutanese | 99.8 /100 | #37 | Exceptional 2.0% |
| Immigrants | Kuwait | 99.8 /100 | #38 | Exceptional 2.0% |
| Zimbabweans | 99.7 /100 | #39 | Exceptional 2.0% |
| Immigrants | Ireland | 99.7 /100 | #40 | Exceptional 2.0% |
| Cypriots | 99.7 /100 | #41 | Exceptional 2.0% |