Dominican vs Immigrants from Ireland Master's Degree
COMPARE
Dominican
Immigrants from Ireland
Master's Degree
Master's Degree Comparison
Dominicans
Immigrants from Ireland
12.5%
MASTER'S DEGREE
0.6/ 100
METRIC RATING
260th/ 347
METRIC RANK
20.4%
MASTER'S DEGREE
100.0/ 100
METRIC RATING
21st/ 347
METRIC RANK
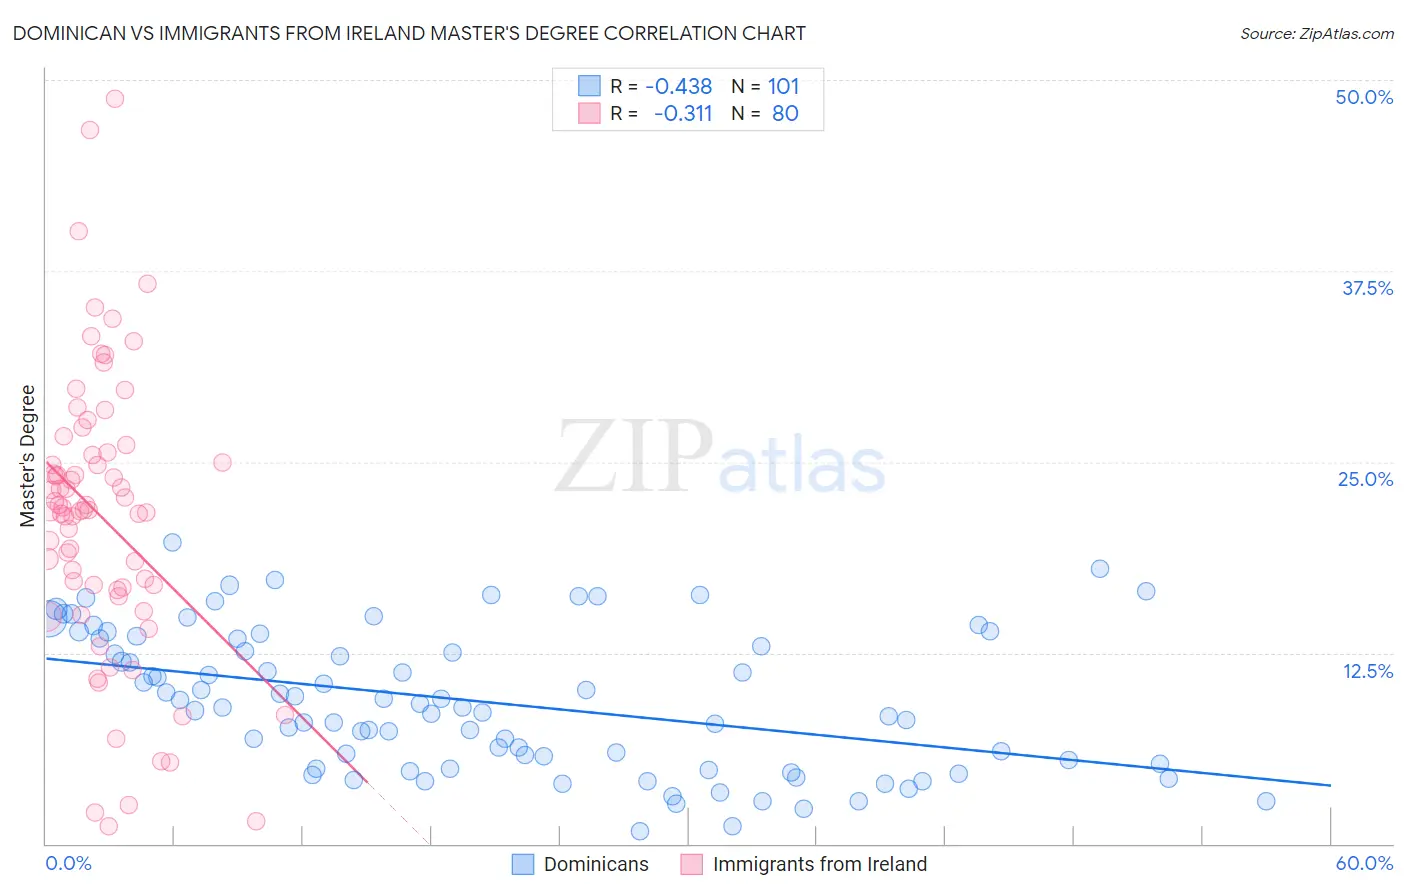
Dominican vs Immigrants from Ireland Master's Degree Correlation Chart
The statistical analysis conducted on geographies consisting of 354,930,218 people shows a moderate negative correlation between the proportion of Dominicans and percentage of population with at least master's degree education in the United States with a correlation coefficient (R) of -0.438 and weighted average of 12.5%. Similarly, the statistical analysis conducted on geographies consisting of 240,764,624 people shows a mild negative correlation between the proportion of Immigrants from Ireland and percentage of population with at least master's degree education in the United States with a correlation coefficient (R) of -0.311 and weighted average of 20.4%, a difference of 63.5%.
Master's Degree Correlation Summary
| Measurement | Dominican | Immigrants from Ireland |
| Minimum | 0.79% | 1.1% |
| Maximum | 19.7% | 48.7% |
| Range | 18.9% | 47.6% |
| Mean | 9.3% | 21.3% |
| Median | 9.0% | 21.8% |
| Interquartile 25% (IQ1) | 5.1% | 16.7% |
| Interquartile 75% (IQ3) | 13.4% | 25.5% |
| Interquartile Range (IQR) | 8.3% | 8.8% |
| Standard Deviation (Sample) | 4.6% | 9.3% |
| Standard Deviation (Population) | 4.5% | 9.3% |
Similar Demographics by Master's Degree
Demographics Similar to Dominicans by Master's Degree
In terms of master's degree, the demographic groups most similar to Dominicans are Japanese (12.5%, a difference of 0.010%), Tongan (12.5%, a difference of 0.040%), Immigrants from Liberia (12.5%, a difference of 0.10%), Nicaraguan (12.5%, a difference of 0.22%), and Central American Indian (12.4%, a difference of 0.46%).
| Demographics | Rating | Rank | Master's Degree |
| Immigrants | Dominica | 0.8 /100 | #253 | Tragic 12.6% |
| Indonesians | 0.8 /100 | #254 | Tragic 12.6% |
| Immigrants | Congo | 0.8 /100 | #255 | Tragic 12.6% |
| Immigrants | Portugal | 0.8 /100 | #256 | Tragic 12.6% |
| Osage | 0.7 /100 | #257 | Tragic 12.6% |
| Immigrants | Liberia | 0.6 /100 | #258 | Tragic 12.5% |
| Japanese | 0.6 /100 | #259 | Tragic 12.5% |
| Dominicans | 0.6 /100 | #260 | Tragic 12.5% |
| Tongans | 0.6 /100 | #261 | Tragic 12.5% |
| Nicaraguans | 0.6 /100 | #262 | Tragic 12.5% |
| Central American Indians | 0.5 /100 | #263 | Tragic 12.4% |
| Belizeans | 0.5 /100 | #264 | Tragic 12.4% |
| Immigrants | Fiji | 0.5 /100 | #265 | Tragic 12.4% |
| Bahamians | 0.5 /100 | #266 | Tragic 12.4% |
| Americans | 0.4 /100 | #267 | Tragic 12.3% |
Demographics Similar to Immigrants from Ireland by Master's Degree
In terms of master's degree, the demographic groups most similar to Immigrants from Ireland are Indian (Asian) (20.5%, a difference of 0.11%), Immigrants from Hong Kong (20.5%, a difference of 0.13%), Israeli (20.3%, a difference of 0.42%), Soviet Union (20.5%, a difference of 0.48%), and Immigrants from France (20.3%, a difference of 0.70%).
| Demographics | Rating | Rank | Master's Degree |
| Immigrants | Switzerland | 100.0 /100 | #14 | Exceptional 20.9% |
| Immigrants | Eastern Asia | 100.0 /100 | #15 | Exceptional 20.8% |
| Immigrants | Belgium | 100.0 /100 | #16 | Exceptional 20.8% |
| Immigrants | South Central Asia | 100.0 /100 | #17 | Exceptional 20.7% |
| Soviet Union | 100.0 /100 | #18 | Exceptional 20.5% |
| Immigrants | Hong Kong | 100.0 /100 | #19 | Exceptional 20.5% |
| Indians (Asian) | 100.0 /100 | #20 | Exceptional 20.5% |
| Immigrants | Ireland | 100.0 /100 | #21 | Exceptional 20.4% |
| Israelis | 100.0 /100 | #22 | Exceptional 20.3% |
| Immigrants | France | 100.0 /100 | #23 | Exceptional 20.3% |
| Immigrants | Sweden | 100.0 /100 | #24 | Exceptional 20.3% |
| Immigrants | Japan | 100.0 /100 | #25 | Exceptional 20.0% |
| Cambodians | 100.0 /100 | #26 | Exceptional 20.0% |
| Immigrants | Sri Lanka | 100.0 /100 | #27 | Exceptional 19.9% |
| Turks | 100.0 /100 | #28 | Exceptional 19.9% |