Dominican vs Immigrants from Ireland Male Disability
COMPARE
Dominican
Immigrants from Ireland
Male Disability
Male Disability Comparison
Dominicans
Immigrants from Ireland
11.8%
MALE DISABILITY
1.8/ 100
METRIC RATING
231st/ 347
METRIC RANK
10.6%
MALE DISABILITY
97.9/ 100
METRIC RATING
86th/ 347
METRIC RANK
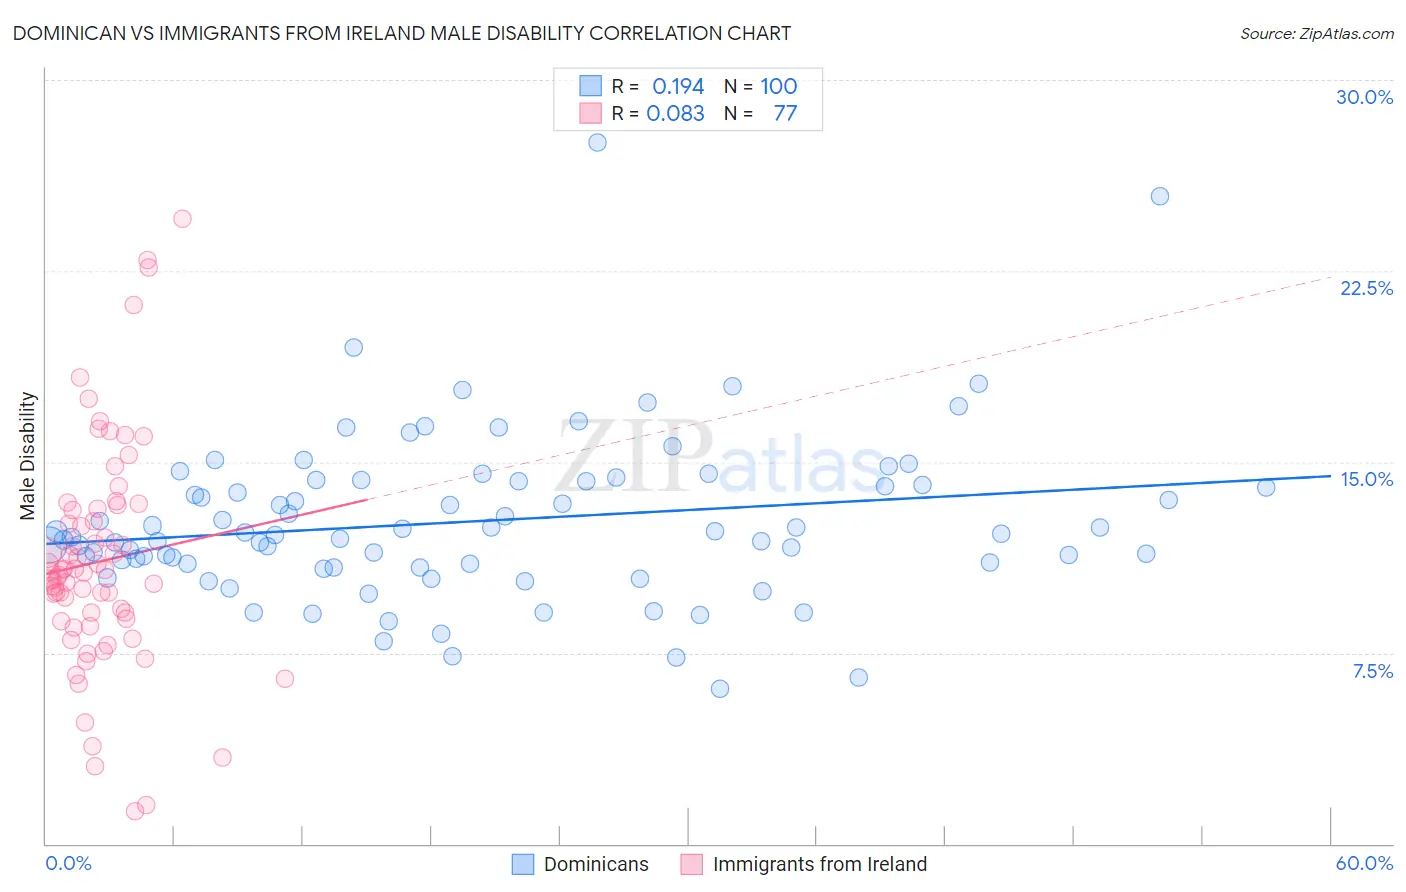
Dominican vs Immigrants from Ireland Male Disability Correlation Chart
The statistical analysis conducted on geographies consisting of 355,013,685 people shows a poor positive correlation between the proportion of Dominicans and percentage of males with a disability in the United States with a correlation coefficient (R) of 0.194 and weighted average of 11.8%. Similarly, the statistical analysis conducted on geographies consisting of 240,771,844 people shows a slight positive correlation between the proportion of Immigrants from Ireland and percentage of males with a disability in the United States with a correlation coefficient (R) of 0.083 and weighted average of 10.6%, a difference of 11.4%.
Male Disability Correlation Summary
| Measurement | Dominican | Immigrants from Ireland |
| Minimum | 6.1% | 1.3% |
| Maximum | 27.5% | 24.5% |
| Range | 21.4% | 23.2% |
| Mean | 12.7% | 11.1% |
| Median | 12.1% | 10.6% |
| Interquartile 25% (IQ1) | 11.0% | 8.8% |
| Interquartile 75% (IQ3) | 14.3% | 13.2% |
| Interquartile Range (IQR) | 3.3% | 4.4% |
| Standard Deviation (Sample) | 3.3% | 4.4% |
| Standard Deviation (Population) | 3.3% | 4.4% |
Similar Demographics by Male Disability
Demographics Similar to Dominicans by Male Disability
In terms of male disability, the demographic groups most similar to Dominicans are Malaysian (11.8%, a difference of 0.060%), Mexican (11.8%, a difference of 0.10%), Immigrants from Canada (11.9%, a difference of 0.18%), Croatian (11.8%, a difference of 0.20%), and Bermudan (11.8%, a difference of 0.28%).
| Demographics | Rating | Rank | Male Disability |
| Japanese | 3.1 /100 | #224 | Tragic 11.7% |
| Liberians | 3.1 /100 | #225 | Tragic 11.8% |
| Sub-Saharan Africans | 2.8 /100 | #226 | Tragic 11.8% |
| Austrians | 2.5 /100 | #227 | Tragic 11.8% |
| Hispanics or Latinos | 2.3 /100 | #228 | Tragic 11.8% |
| Bermudans | 2.3 /100 | #229 | Tragic 11.8% |
| Croatians | 2.1 /100 | #230 | Tragic 11.8% |
| Dominicans | 1.8 /100 | #231 | Tragic 11.8% |
| Malaysians | 1.8 /100 | #232 | Tragic 11.8% |
| Mexicans | 1.7 /100 | #233 | Tragic 11.8% |
| Immigrants | Canada | 1.6 /100 | #234 | Tragic 11.9% |
| Immigrants | North America | 1.5 /100 | #235 | Tragic 11.9% |
| U.S. Virgin Islanders | 1.3 /100 | #236 | Tragic 11.9% |
| Carpatho Rusyns | 1.3 /100 | #237 | Tragic 11.9% |
| Yugoslavians | 1.2 /100 | #238 | Tragic 11.9% |
Demographics Similar to Immigrants from Ireland by Male Disability
In terms of male disability, the demographic groups most similar to Immigrants from Ireland are Sri Lankan (10.6%, a difference of 0.010%), Immigrants from Vietnam (10.6%, a difference of 0.020%), Immigrants from Western Asia (10.6%, a difference of 0.090%), Immigrants from Nicaragua (10.6%, a difference of 0.090%), and Immigrants from Morocco (10.6%, a difference of 0.14%).
| Demographics | Rating | Rank | Male Disability |
| Zimbabweans | 98.4 /100 | #79 | Exceptional 10.6% |
| Immigrants | Jordan | 98.4 /100 | #80 | Exceptional 10.6% |
| Immigrants | Chile | 98.3 /100 | #81 | Exceptional 10.6% |
| Immigrants | Guyana | 98.2 /100 | #82 | Exceptional 10.6% |
| Immigrants | Poland | 98.1 /100 | #83 | Exceptional 10.6% |
| Bulgarians | 98.1 /100 | #84 | Exceptional 10.6% |
| Sri Lankans | 97.9 /100 | #85 | Exceptional 10.6% |
| Immigrants | Ireland | 97.9 /100 | #86 | Exceptional 10.6% |
| Immigrants | Vietnam | 97.9 /100 | #87 | Exceptional 10.6% |
| Immigrants | Western Asia | 97.8 /100 | #88 | Exceptional 10.6% |
| Immigrants | Nicaragua | 97.8 /100 | #89 | Exceptional 10.6% |
| Immigrants | Morocco | 97.7 /100 | #90 | Exceptional 10.6% |
| Immigrants | France | 97.6 /100 | #91 | Exceptional 10.6% |
| Palestinians | 97.4 /100 | #92 | Exceptional 10.7% |
| Immigrants | St. Vincent and the Grenadines | 97.1 /100 | #93 | Exceptional 10.7% |