Dominican vs Central American Indian Seniors Poverty Over the Age of 75
COMPARE
Dominican
Central American Indian
Seniors Poverty Over the Age of 75
Seniors Poverty Over the Age of 75 Comparison
Dominicans
Central American Indians
19.6%
SENIORS POVERTY OVER THE AGE OF 75
0.0/ 100
METRIC RATING
342nd/ 347
METRIC RANK
16.5%
SENIORS POVERTY OVER THE AGE OF 75
0.0/ 100
METRIC RATING
323rd/ 347
METRIC RANK
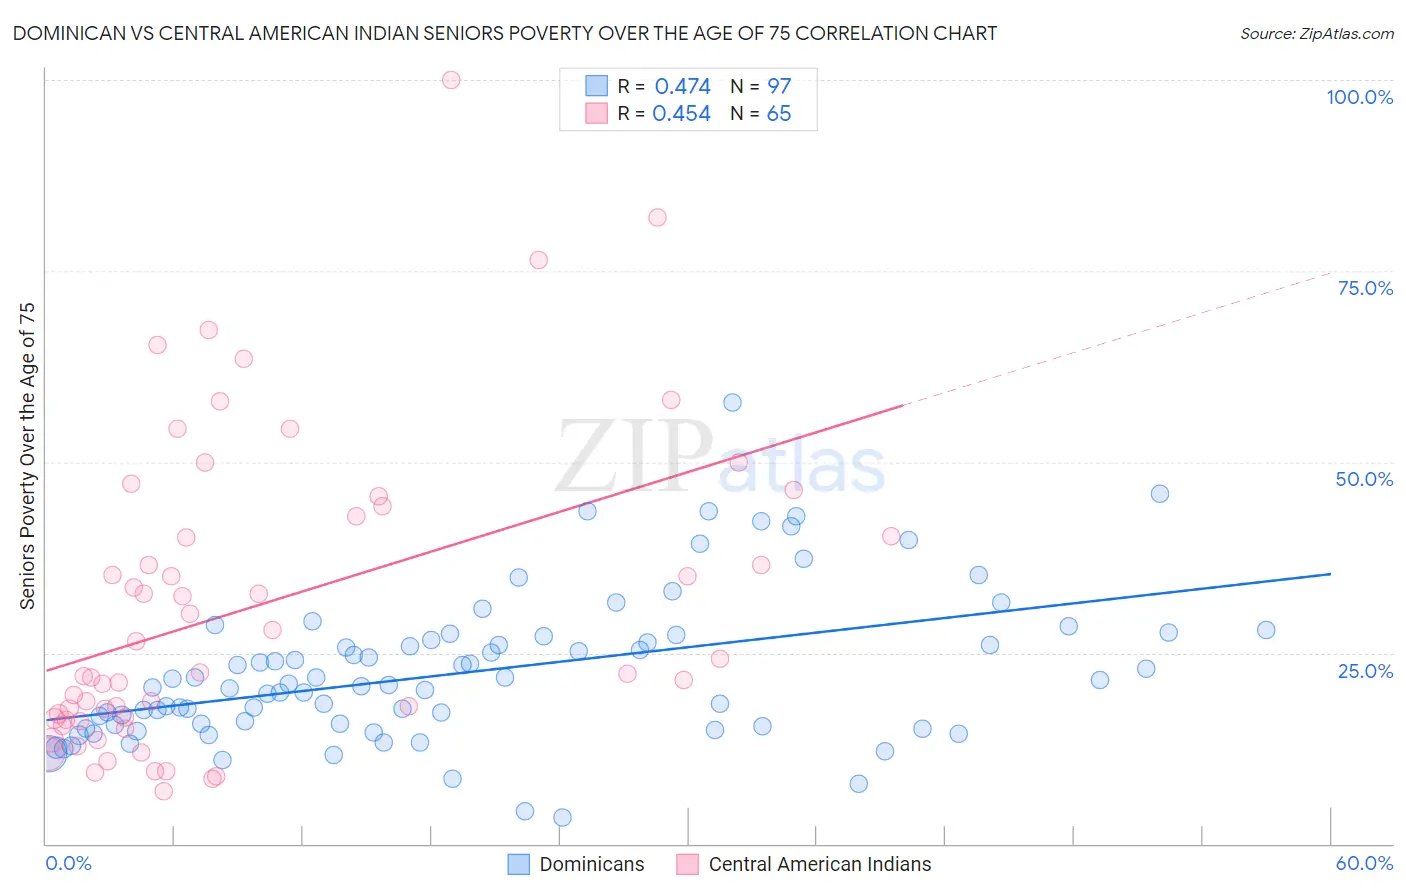
Dominican vs Central American Indian Seniors Poverty Over the Age of 75 Correlation Chart
The statistical analysis conducted on geographies consisting of 350,851,052 people shows a moderate positive correlation between the proportion of Dominicans and poverty level among seniors over the age of 75 in the United States with a correlation coefficient (R) of 0.474 and weighted average of 19.6%. Similarly, the statistical analysis conducted on geographies consisting of 323,772,656 people shows a moderate positive correlation between the proportion of Central American Indians and poverty level among seniors over the age of 75 in the United States with a correlation coefficient (R) of 0.454 and weighted average of 16.5%, a difference of 18.6%.
Seniors Poverty Over the Age of 75 Correlation Summary
| Measurement | Dominican | Central American Indian |
| Minimum | 3.4% | 6.9% |
| Maximum | 57.7% | 100.0% |
| Range | 54.4% | 93.1% |
| Mean | 22.5% | 31.1% |
| Median | 20.8% | 22.4% |
| Interquartile 25% (IQ1) | 15.5% | 16.4% |
| Interquartile 75% (IQ3) | 27.0% | 43.5% |
| Interquartile Range (IQR) | 11.5% | 27.1% |
| Standard Deviation (Sample) | 9.7% | 20.1% |
| Standard Deviation (Population) | 9.6% | 20.0% |
Demographics Similar to Dominicans and Central American Indians by Seniors Poverty Over the Age of 75
In terms of seniors poverty over the age of 75, the demographic groups most similar to Dominicans are Navajo (19.4%, a difference of 1.2%), Tohono O'odham (19.1%, a difference of 2.5%), Hopi (18.9%, a difference of 4.0%), Immigrants from Cabo Verde (18.5%, a difference of 6.1%), and Yakama (18.3%, a difference of 7.1%). Similarly, the demographic groups most similar to Central American Indians are Immigrants from Uzbekistan (16.5%, a difference of 0.050%), Immigrants from Barbados (16.5%, a difference of 0.090%), Nicaraguan (16.6%, a difference of 0.43%), Pueblo (16.7%, a difference of 1.1%), and Sioux (16.8%, a difference of 1.3%).
| Demographics | Rating | Rank | Seniors Poverty Over the Age of 75 |
| Immigrants | Barbados | 0.0 /100 | #322 | Tragic 16.5% |
| Central American Indians | 0.0 /100 | #323 | Tragic 16.5% |
| Immigrants | Uzbekistan | 0.0 /100 | #324 | Tragic 16.5% |
| Nicaraguans | 0.0 /100 | #325 | Tragic 16.6% |
| Pueblo | 0.0 /100 | #326 | Tragic 16.7% |
| Sioux | 0.0 /100 | #327 | Tragic 16.8% |
| Cape Verdeans | 0.0 /100 | #328 | Tragic 16.8% |
| Immigrants | Dominica | 0.0 /100 | #329 | Tragic 17.0% |
| British West Indians | 0.0 /100 | #330 | Tragic 17.4% |
| Immigrants | Armenia | 0.0 /100 | #331 | Tragic 17.5% |
| Immigrants | St. Vincent and the Grenadines | 0.0 /100 | #332 | Tragic 17.5% |
| Immigrants | Nicaragua | 0.0 /100 | #333 | Tragic 17.6% |
| Immigrants | Grenada | 0.0 /100 | #334 | Tragic 17.8% |
| Cubans | 0.0 /100 | #335 | Tragic 18.0% |
| Immigrants | Caribbean | 0.0 /100 | #336 | Tragic 18.2% |
| Yakama | 0.0 /100 | #337 | Tragic 18.3% |
| Immigrants | Cabo Verde | 0.0 /100 | #338 | Tragic 18.5% |
| Hopi | 0.0 /100 | #339 | Tragic 18.9% |
| Tohono O'odham | 0.0 /100 | #340 | Tragic 19.1% |
| Navajo | 0.0 /100 | #341 | Tragic 19.4% |
| Dominicans | 0.0 /100 | #342 | Tragic 19.6% |