Immigrants from Philippines vs Syrian Disability Age Under 5
COMPARE
Immigrants from Philippines
Syrian
Disability Age Under 5
Disability Age Under 5 Comparison
Immigrants from Philippines
Syrians
1.2%
DISABILITY AGE UNDER 5
93.5/ 100
METRIC RATING
117th/ 347
METRIC RANK
1.3%
DISABILITY AGE UNDER 5
16.1/ 100
METRIC RATING
215th/ 347
METRIC RANK
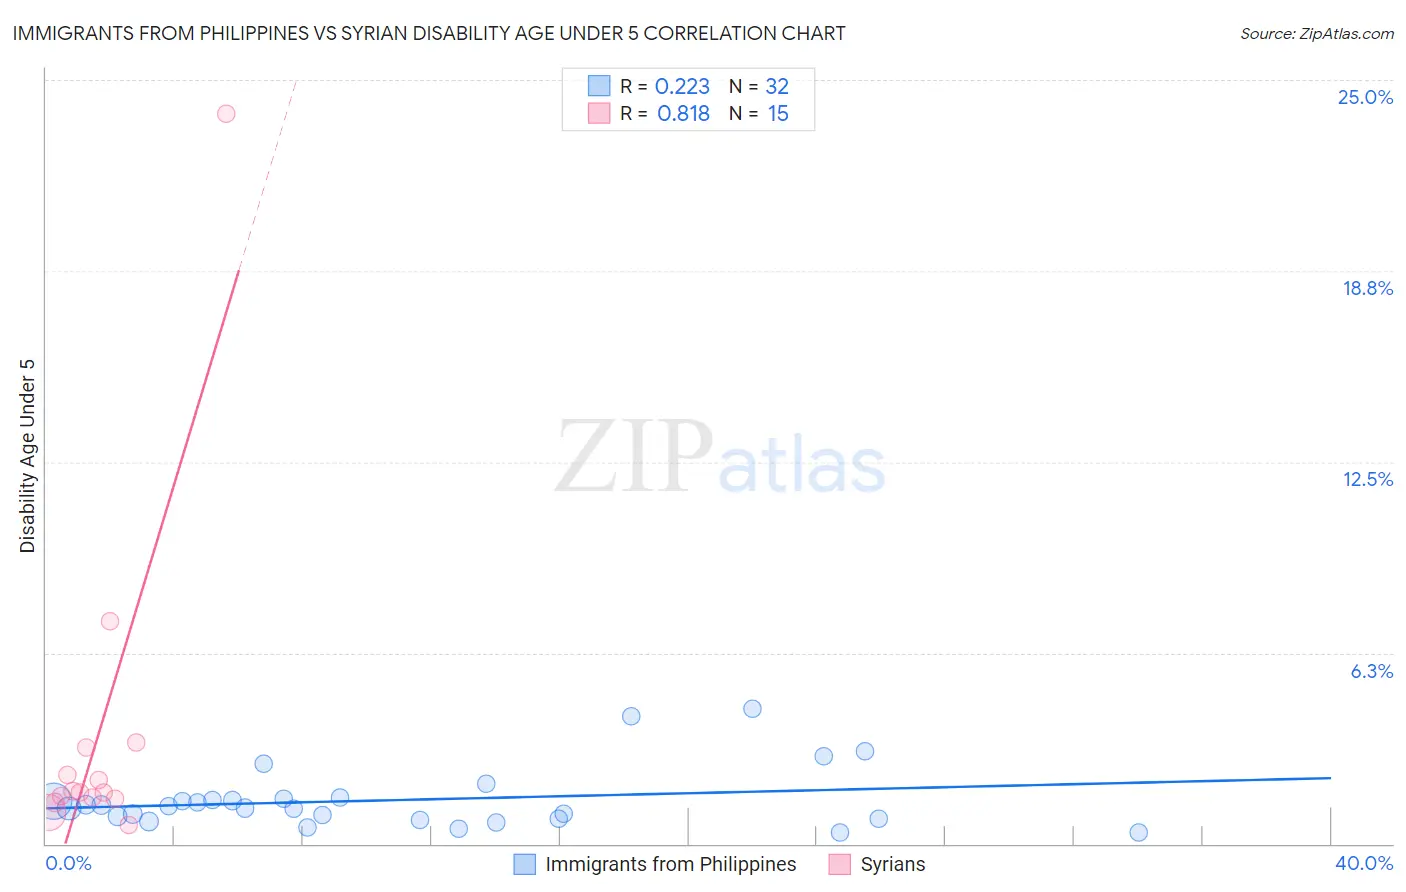
Immigrants from Philippines vs Syrian Disability Age Under 5 Correlation Chart
The statistical analysis conducted on geographies consisting of 241,635,312 people shows a weak positive correlation between the proportion of Immigrants from Philippines and percentage of population with a disability under the age of 5 in the United States with a correlation coefficient (R) of 0.223 and weighted average of 1.2%. Similarly, the statistical analysis conducted on geographies consisting of 161,568,147 people shows a very strong positive correlation between the proportion of Syrians and percentage of population with a disability under the age of 5 in the United States with a correlation coefficient (R) of 0.818 and weighted average of 1.3%, a difference of 10.4%.
Disability Age Under 5 Correlation Summary
| Measurement | Immigrants from Philippines | Syrian |
| Minimum | 0.35% | 0.60% |
| Maximum | 4.4% | 23.9% |
| Range | 4.0% | 23.3% |
| Mean | 1.4% | 3.6% |
| Median | 1.2% | 1.7% |
| Interquartile 25% (IQ1) | 0.83% | 1.5% |
| Interquartile 75% (IQ3) | 1.5% | 3.1% |
| Interquartile Range (IQR) | 0.64% | 1.7% |
| Standard Deviation (Sample) | 0.99% | 5.8% |
| Standard Deviation (Population) | 0.97% | 5.6% |
Similar Demographics by Disability Age Under 5
Demographics Similar to Immigrants from Philippines by Disability Age Under 5
In terms of disability age under 5, the demographic groups most similar to Immigrants from Philippines are Immigrants from Venezuela (1.2%, a difference of 0.030%), Immigrants from Northern Africa (1.2%, a difference of 0.13%), Immigrants from Caribbean (1.2%, a difference of 0.15%), Belizean (1.2%, a difference of 0.17%), and Immigrants from Oceania (1.2%, a difference of 0.31%).
| Demographics | Rating | Rank | Disability Age Under 5 |
| Immigrants | Lebanon | 95.0 /100 | #110 | Exceptional 1.2% |
| Senegalese | 94.6 /100 | #111 | Exceptional 1.2% |
| Immigrants | Australia | 94.4 /100 | #112 | Exceptional 1.2% |
| Immigrants | Oceania | 94.2 /100 | #113 | Exceptional 1.2% |
| Belizeans | 93.9 /100 | #114 | Exceptional 1.2% |
| Immigrants | Caribbean | 93.8 /100 | #115 | Exceptional 1.2% |
| Immigrants | Northern Africa | 93.8 /100 | #116 | Exceptional 1.2% |
| Immigrants | Philippines | 93.5 /100 | #117 | Exceptional 1.2% |
| Immigrants | Venezuela | 93.4 /100 | #118 | Exceptional 1.2% |
| Bhutanese | 92.5 /100 | #119 | Exceptional 1.2% |
| Immigrants | Eritrea | 92.3 /100 | #120 | Exceptional 1.2% |
| Immigrants | Senegal | 91.4 /100 | #121 | Exceptional 1.2% |
| Aleuts | 90.7 /100 | #122 | Exceptional 1.2% |
| Zimbabweans | 90.6 /100 | #123 | Exceptional 1.2% |
| Immigrants | Cambodia | 90.5 /100 | #124 | Exceptional 1.2% |
Demographics Similar to Syrians by Disability Age Under 5
In terms of disability age under 5, the demographic groups most similar to Syrians are Bangladeshi (1.3%, a difference of 0.10%), Immigrants from Chile (1.3%, a difference of 0.17%), Cypriot (1.3%, a difference of 0.20%), Immigrants from Sudan (1.3%, a difference of 0.40%), and Chilean (1.3%, a difference of 0.41%).
| Demographics | Rating | Rank | Disability Age Under 5 |
| Mexicans | 20.8 /100 | #208 | Fair 1.3% |
| Bulgarians | 19.5 /100 | #209 | Poor 1.3% |
| Pakistanis | 19.4 /100 | #210 | Poor 1.3% |
| Immigrants | Greece | 19.1 /100 | #211 | Poor 1.3% |
| Chileans | 18.8 /100 | #212 | Poor 1.3% |
| Immigrants | Sudan | 18.7 /100 | #213 | Poor 1.3% |
| Immigrants | Chile | 17.2 /100 | #214 | Poor 1.3% |
| Syrians | 16.1 /100 | #215 | Poor 1.3% |
| Bangladeshis | 15.5 /100 | #216 | Poor 1.3% |
| Cypriots | 14.9 /100 | #217 | Poor 1.3% |
| Malaysians | 13.2 /100 | #218 | Poor 1.3% |
| Immigrants | Croatia | 11.2 /100 | #219 | Poor 1.3% |
| Serbians | 9.6 /100 | #220 | Tragic 1.3% |
| Sub-Saharan Africans | 8.3 /100 | #221 | Tragic 1.3% |
| Ukrainians | 8.3 /100 | #222 | Tragic 1.3% |