Immigrants from Armenia vs Syrian Disability Age Under 5
COMPARE
Immigrants from Armenia
Syrian
Disability Age Under 5
Disability Age Under 5 Comparison
Immigrants from Armenia
Syrians
0.76%
DISABILITY AGE UNDER 5
100.0/ 100
METRIC RATING
1st/ 347
METRIC RANK
1.3%
DISABILITY AGE UNDER 5
16.1/ 100
METRIC RATING
215th/ 347
METRIC RANK
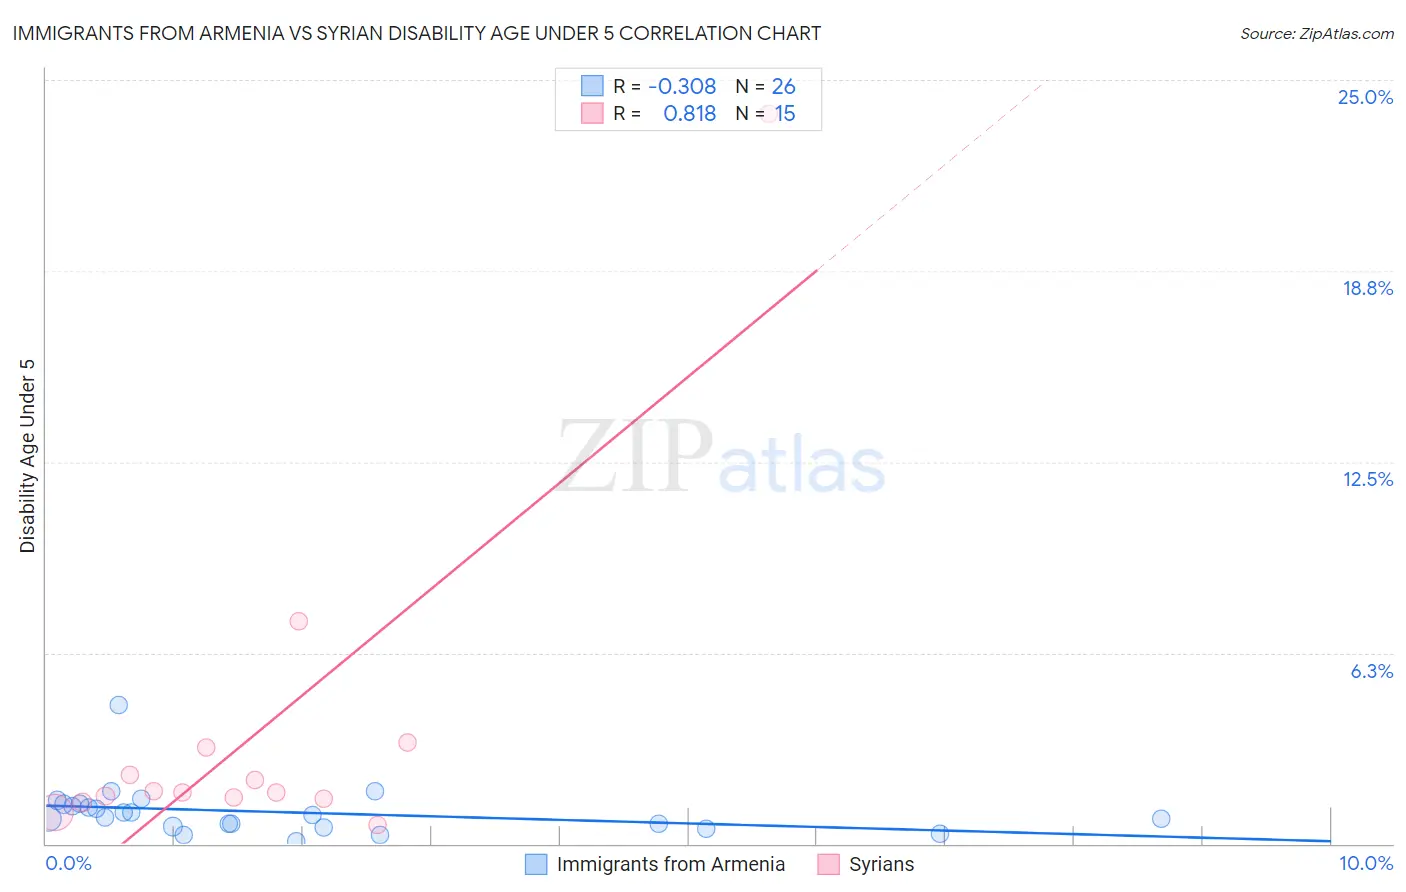
Immigrants from Armenia vs Syrian Disability Age Under 5 Correlation Chart
The statistical analysis conducted on geographies consisting of 73,758,822 people shows a mild negative correlation between the proportion of Immigrants from Armenia and percentage of population with a disability under the age of 5 in the United States with a correlation coefficient (R) of -0.308 and weighted average of 0.76%. Similarly, the statistical analysis conducted on geographies consisting of 161,568,147 people shows a very strong positive correlation between the proportion of Syrians and percentage of population with a disability under the age of 5 in the United States with a correlation coefficient (R) of 0.818 and weighted average of 1.3%, a difference of 70.1%.
Disability Age Under 5 Correlation Summary
| Measurement | Immigrants from Armenia | Syrian |
| Minimum | 0.070% | 0.60% |
| Maximum | 4.6% | 23.9% |
| Range | 4.5% | 23.3% |
| Mean | 1.0% | 3.6% |
| Median | 0.90% | 1.7% |
| Interquartile 25% (IQ1) | 0.57% | 1.5% |
| Interquartile 75% (IQ3) | 1.3% | 3.1% |
| Interquartile Range (IQR) | 0.73% | 1.7% |
| Standard Deviation (Sample) | 0.84% | 5.8% |
| Standard Deviation (Population) | 0.83% | 5.6% |
Similar Demographics by Disability Age Under 5
Demographics Similar to Immigrants from Armenia by Disability Age Under 5
In terms of disability age under 5, the demographic groups most similar to Immigrants from Armenia are Immigrants from St. Vincent and the Grenadines (0.79%, a difference of 4.1%), Vietnamese (0.81%, a difference of 7.4%), Immigrants from Uzbekistan (0.85%, a difference of 12.3%), Immigrants from Bangladesh (0.85%, a difference of 12.8%), and Ute (0.86%, a difference of 13.8%).
| Demographics | Rating | Rank | Disability Age Under 5 |
| Immigrants | Armenia | 100.0 /100 | #1 | Exceptional 0.76% |
| Immigrants | St. Vincent and the Grenadines | 100.0 /100 | #2 | Exceptional 0.79% |
| Vietnamese | 100.0 /100 | #3 | Exceptional 0.81% |
| Immigrants | Uzbekistan | 100.0 /100 | #4 | Exceptional 0.85% |
| Immigrants | Bangladesh | 100.0 /100 | #5 | Exceptional 0.85% |
| Ute | 100.0 /100 | #6 | Exceptional 0.86% |
| Immigrants | Afghanistan | 100.0 /100 | #7 | Exceptional 0.91% |
| Immigrants | Yemen | 100.0 /100 | #8 | Exceptional 0.91% |
| Immigrants | Fiji | 100.0 /100 | #9 | Exceptional 0.92% |
| Marshallese | 100.0 /100 | #10 | Exceptional 0.94% |
| Afghans | 100.0 /100 | #11 | Exceptional 0.94% |
| Immigrants | Grenada | 100.0 /100 | #12 | Exceptional 0.94% |
| Soviet Union | 100.0 /100 | #13 | Exceptional 0.95% |
| Yuman | 100.0 /100 | #14 | Exceptional 0.95% |
| Immigrants | Hong Kong | 100.0 /100 | #15 | Exceptional 0.95% |
Demographics Similar to Syrians by Disability Age Under 5
In terms of disability age under 5, the demographic groups most similar to Syrians are Bangladeshi (1.3%, a difference of 0.10%), Immigrants from Chile (1.3%, a difference of 0.17%), Cypriot (1.3%, a difference of 0.20%), Immigrants from Sudan (1.3%, a difference of 0.40%), and Chilean (1.3%, a difference of 0.41%).
| Demographics | Rating | Rank | Disability Age Under 5 |
| Mexicans | 20.8 /100 | #208 | Fair 1.3% |
| Bulgarians | 19.5 /100 | #209 | Poor 1.3% |
| Pakistanis | 19.4 /100 | #210 | Poor 1.3% |
| Immigrants | Greece | 19.1 /100 | #211 | Poor 1.3% |
| Chileans | 18.8 /100 | #212 | Poor 1.3% |
| Immigrants | Sudan | 18.7 /100 | #213 | Poor 1.3% |
| Immigrants | Chile | 17.2 /100 | #214 | Poor 1.3% |
| Syrians | 16.1 /100 | #215 | Poor 1.3% |
| Bangladeshis | 15.5 /100 | #216 | Poor 1.3% |
| Cypriots | 14.9 /100 | #217 | Poor 1.3% |
| Malaysians | 13.2 /100 | #218 | Poor 1.3% |
| Immigrants | Croatia | 11.2 /100 | #219 | Poor 1.3% |
| Serbians | 9.6 /100 | #220 | Tragic 1.3% |
| Sub-Saharan Africans | 8.3 /100 | #221 | Tragic 1.3% |
| Ukrainians | 8.3 /100 | #222 | Tragic 1.3% |