Cuban vs Finnish Disability Age Under 5
COMPARE
Cuban
Finnish
Disability Age Under 5
Disability Age Under 5 Comparison
Cubans
Finns
1.2%
DISABILITY AGE UNDER 5
42.5/ 100
METRIC RATING
186th/ 347
METRIC RANK
1.6%
DISABILITY AGE UNDER 5
0.0/ 100
METRIC RATING
295th/ 347
METRIC RANK
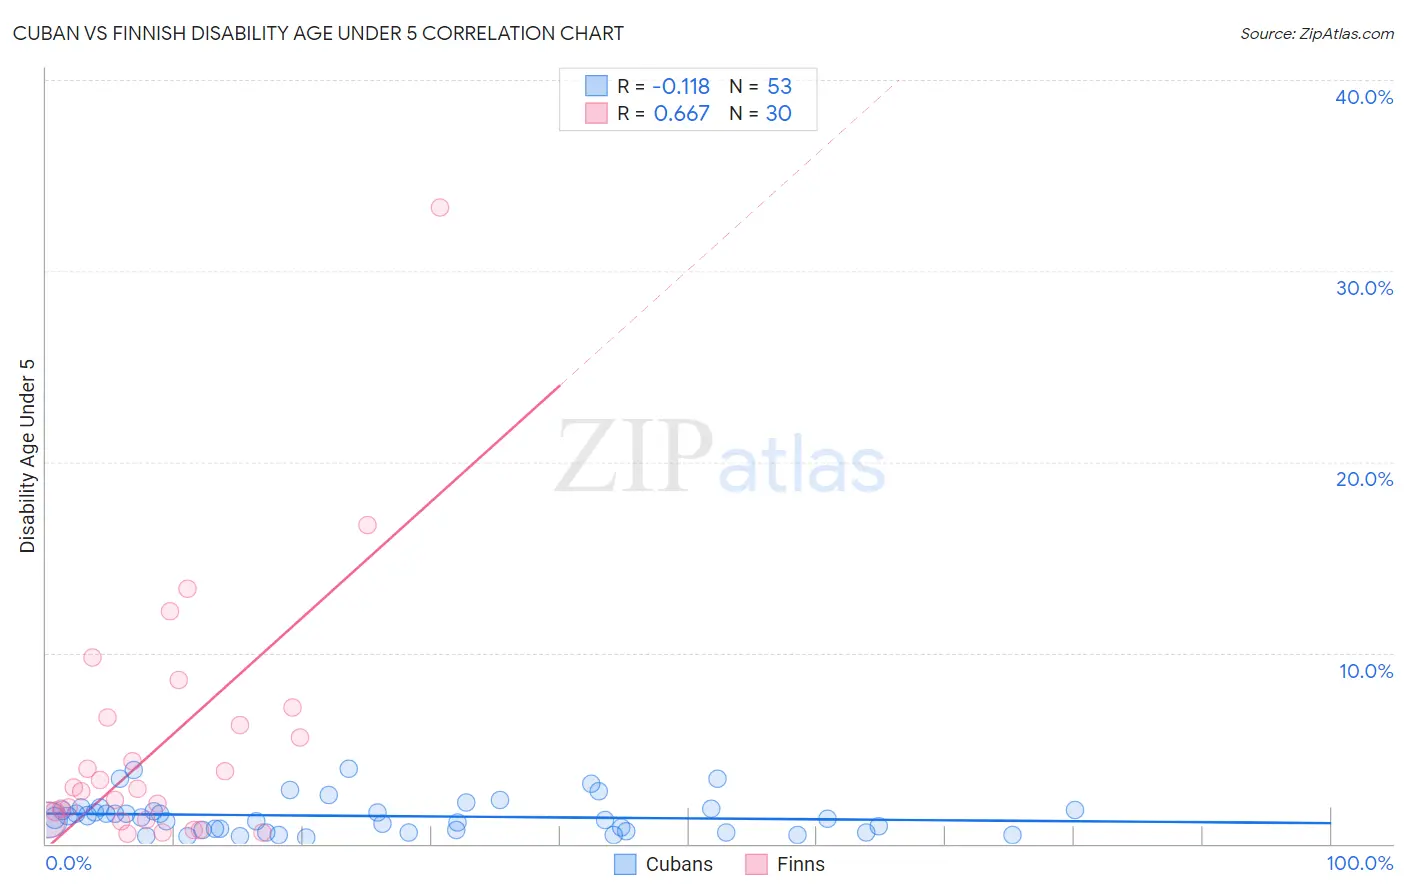
Cuban vs Finnish Disability Age Under 5 Correlation Chart
The statistical analysis conducted on geographies consisting of 234,247,835 people shows a poor negative correlation between the proportion of Cubans and percentage of population with a disability under the age of 5 in the United States with a correlation coefficient (R) of -0.118 and weighted average of 1.2%. Similarly, the statistical analysis conducted on geographies consisting of 211,536,614 people shows a significant positive correlation between the proportion of Finns and percentage of population with a disability under the age of 5 in the United States with a correlation coefficient (R) of 0.667 and weighted average of 1.6%, a difference of 27.3%.
Disability Age Under 5 Correlation Summary
| Measurement | Cuban | Finnish |
| Minimum | 0.29% | 0.51% |
| Maximum | 3.9% | 33.3% |
| Range | 3.6% | 32.8% |
| Mean | 1.5% | 5.3% |
| Median | 1.4% | 2.9% |
| Interquartile 25% (IQ1) | 0.66% | 1.3% |
| Interquartile 75% (IQ3) | 1.8% | 6.6% |
| Interquartile Range (IQR) | 1.1% | 5.4% |
| Standard Deviation (Sample) | 0.93% | 6.7% |
| Standard Deviation (Population) | 0.92% | 6.6% |
Similar Demographics by Disability Age Under 5
Demographics Similar to Cubans by Disability Age Under 5
In terms of disability age under 5, the demographic groups most similar to Cubans are Immigrants from Western Africa (1.2%, a difference of 0.0%), Palestinian (1.2%, a difference of 0.050%), Immigrants from Saudi Arabia (1.2%, a difference of 0.080%), Macedonian (1.2%, a difference of 0.12%), and Immigrants from Peru (1.2%, a difference of 0.12%).
| Demographics | Rating | Rank | Disability Age Under 5 |
| Immigrants | Bahamas | 45.2 /100 | #179 | Average 1.2% |
| Immigrants | Mexico | 44.4 /100 | #180 | Average 1.2% |
| Macedonians | 43.7 /100 | #181 | Average 1.2% |
| Immigrants | Peru | 43.7 /100 | #181 | Average 1.2% |
| Immigrants | Saudi Arabia | 43.3 /100 | #183 | Average 1.2% |
| Palestinians | 43.0 /100 | #184 | Average 1.2% |
| Immigrants | Western Africa | 42.5 /100 | #185 | Average 1.2% |
| Cubans | 42.5 /100 | #186 | Average 1.2% |
| Immigrants | Haiti | 40.2 /100 | #187 | Average 1.3% |
| Haitians | 39.9 /100 | #188 | Fair 1.3% |
| Peruvians | 37.6 /100 | #189 | Fair 1.3% |
| Immigrants | Laos | 36.6 /100 | #190 | Fair 1.3% |
| Mexican American Indians | 36.6 /100 | #191 | Fair 1.3% |
| Immigrants | Bosnia and Herzegovina | 36.5 /100 | #192 | Fair 1.3% |
| Immigrants | Sierra Leone | 36.5 /100 | #193 | Fair 1.3% |
Demographics Similar to Finns by Disability Age Under 5
In terms of disability age under 5, the demographic groups most similar to Finns are Polish (1.6%, a difference of 0.080%), Swedish (1.6%, a difference of 0.62%), Nonimmigrants (1.6%, a difference of 1.0%), Cajun (1.6%, a difference of 1.0%), and Portuguese (1.6%, a difference of 1.6%).
| Demographics | Rating | Rank | Disability Age Under 5 |
| Estonians | 0.0 /100 | #288 | Tragic 1.5% |
| Hungarians | 0.0 /100 | #289 | Tragic 1.5% |
| Czechs | 0.0 /100 | #290 | Tragic 1.5% |
| Northern Europeans | 0.0 /100 | #291 | Tragic 1.6% |
| Italians | 0.0 /100 | #292 | Tragic 1.6% |
| Lithuanians | 0.0 /100 | #293 | Tragic 1.6% |
| Swedes | 0.0 /100 | #294 | Tragic 1.6% |
| Finns | 0.0 /100 | #295 | Tragic 1.6% |
| Poles | 0.0 /100 | #296 | Tragic 1.6% |
| Immigrants | Nonimmigrants | 0.0 /100 | #297 | Tragic 1.6% |
| Cajuns | 0.0 /100 | #298 | Tragic 1.6% |
| Portuguese | 0.0 /100 | #299 | Tragic 1.6% |
| Shoshone | 0.0 /100 | #300 | Tragic 1.6% |
| German Russians | 0.0 /100 | #301 | Tragic 1.6% |
| Welsh | 0.0 /100 | #302 | Tragic 1.6% |