Cuban vs Finnish 6th Grade
COMPARE
Cuban
Finnish
6th Grade
6th Grade Comparison
Cubans
Finns
96.2%
6TH GRADE
0.1/ 100
METRIC RATING
283rd/ 347
METRIC RANK
98.1%
6TH GRADE
100.0/ 100
METRIC RATING
20th/ 347
METRIC RANK
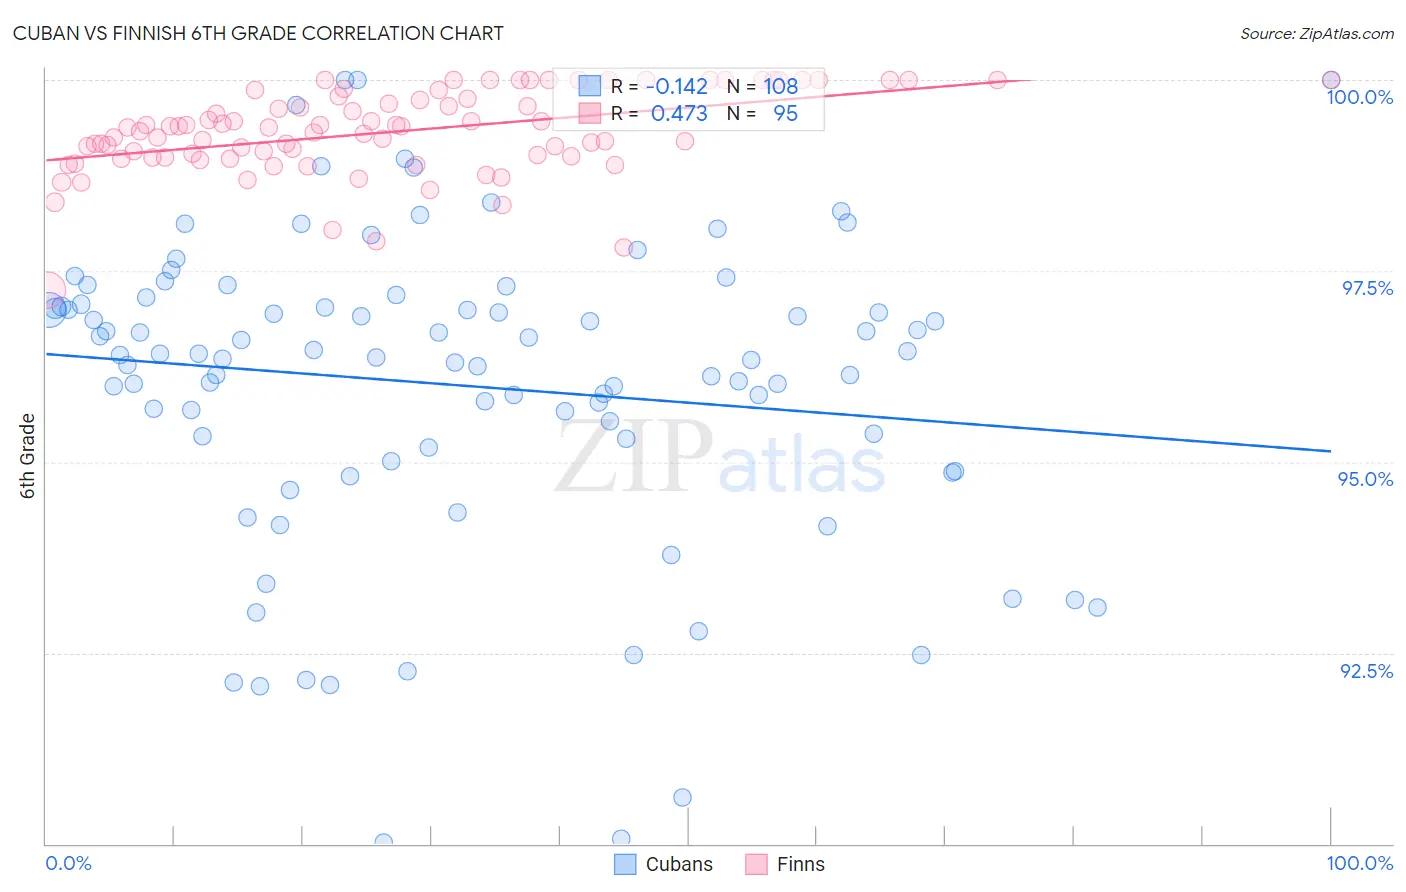
Cuban vs Finnish 6th Grade Correlation Chart
The statistical analysis conducted on geographies consisting of 449,326,865 people shows a poor negative correlation between the proportion of Cubans and percentage of population with at least 6th grade education in the United States with a correlation coefficient (R) of -0.142 and weighted average of 96.2%. Similarly, the statistical analysis conducted on geographies consisting of 404,675,625 people shows a moderate positive correlation between the proportion of Finns and percentage of population with at least 6th grade education in the United States with a correlation coefficient (R) of 0.473 and weighted average of 98.1%, a difference of 1.9%.
6th Grade Correlation Summary
| Measurement | Cuban | Finnish |
| Minimum | 90.0% | 97.2% |
| Maximum | 100.0% | 100.0% |
| Range | 10.0% | 2.8% |
| Mean | 96.0% | 99.3% |
| Median | 96.4% | 99.4% |
| Interquartile 25% (IQ1) | 95.2% | 99.0% |
| Interquartile 75% (IQ3) | 97.0% | 99.8% |
| Interquartile Range (IQR) | 1.8% | 0.79% |
| Standard Deviation (Sample) | 2.0% | 0.56% |
| Standard Deviation (Population) | 2.0% | 0.55% |
Similar Demographics by 6th Grade
Demographics Similar to Cubans by 6th Grade
In terms of 6th grade, the demographic groups most similar to Cubans are Trinidadian and Tobagonian (96.2%, a difference of 0.010%), Houma (96.2%, a difference of 0.010%), Fijian (96.2%, a difference of 0.010%), Immigrants from Peru (96.2%, a difference of 0.020%), and Immigrants from Afghanistan (96.2%, a difference of 0.020%).
| Demographics | Rating | Rank | 6th Grade |
| Yaqui | 0.1 /100 | #276 | Tragic 96.3% |
| Immigrants | Western Africa | 0.1 /100 | #277 | Tragic 96.3% |
| Immigrants | Thailand | 0.1 /100 | #278 | Tragic 96.3% |
| Immigrants | Peru | 0.1 /100 | #279 | Tragic 96.2% |
| Immigrants | Afghanistan | 0.1 /100 | #280 | Tragic 96.2% |
| Trinidadians and Tobagonians | 0.1 /100 | #281 | Tragic 96.2% |
| Houma | 0.1 /100 | #282 | Tragic 96.2% |
| Cubans | 0.1 /100 | #283 | Tragic 96.2% |
| Fijians | 0.1 /100 | #284 | Tragic 96.2% |
| Somalis | 0.1 /100 | #285 | Tragic 96.2% |
| Barbadians | 0.0 /100 | #286 | Tragic 96.2% |
| Immigrants | Trinidad and Tobago | 0.0 /100 | #287 | Tragic 96.2% |
| Malaysians | 0.0 /100 | #288 | Tragic 96.2% |
| Immigrants | Eritrea | 0.0 /100 | #289 | Tragic 96.1% |
| Immigrants | Somalia | 0.0 /100 | #290 | Tragic 96.1% |
Demographics Similar to Finns by 6th Grade
In terms of 6th grade, the demographic groups most similar to Finns are Irish (98.1%, a difference of 0.010%), Lithuanian (98.1%, a difference of 0.010%), Polish (98.1%, a difference of 0.020%), Pennsylvania German (98.1%, a difference of 0.020%), and Inupiat (98.1%, a difference of 0.030%).
| Demographics | Rating | Rank | 6th Grade |
| Tlingit-Haida | 100.0 /100 | #13 | Exceptional 98.1% |
| Carpatho Rusyns | 100.0 /100 | #14 | Exceptional 98.1% |
| Inupiat | 100.0 /100 | #15 | Exceptional 98.1% |
| Scottish | 100.0 /100 | #16 | Exceptional 98.1% |
| Poles | 100.0 /100 | #17 | Exceptional 98.1% |
| Pennsylvania Germans | 100.0 /100 | #18 | Exceptional 98.1% |
| Irish | 100.0 /100 | #19 | Exceptional 98.1% |
| Finns | 100.0 /100 | #20 | Exceptional 98.1% |
| Lithuanians | 100.0 /100 | #21 | Exceptional 98.1% |
| Danes | 100.0 /100 | #22 | Exceptional 98.0% |
| Sioux | 100.0 /100 | #23 | Exceptional 98.0% |
| Croatians | 100.0 /100 | #24 | Exceptional 98.0% |
| Scotch-Irish | 100.0 /100 | #25 | Exceptional 98.0% |
| Czechs | 100.0 /100 | #26 | Exceptional 98.0% |
| Yup'ik | 100.0 /100 | #27 | Exceptional 98.0% |