Cuban vs Immigrants from North Macedonia Disability Age Under 5
COMPARE
Cuban
Immigrants from North Macedonia
Disability Age Under 5
Disability Age Under 5 Comparison
Cubans
Immigrants from North Macedonia
1.2%
DISABILITY AGE UNDER 5
42.5/ 100
METRIC RATING
186th/ 347
METRIC RANK
1.3%
DISABILITY AGE UNDER 5
34.7/ 100
METRIC RATING
194th/ 347
METRIC RANK
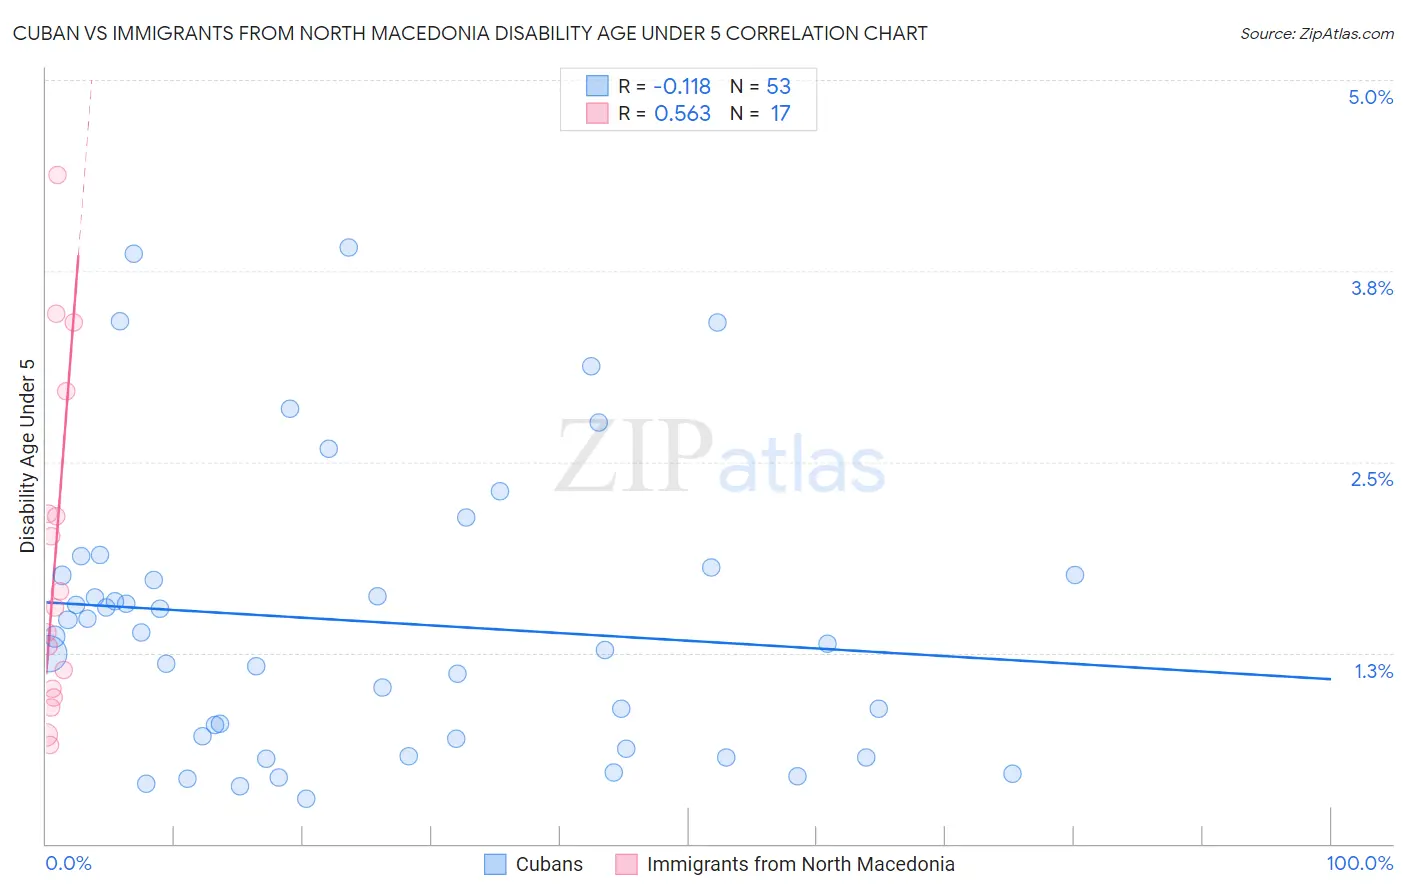
Cuban vs Immigrants from North Macedonia Disability Age Under 5 Correlation Chart
The statistical analysis conducted on geographies consisting of 234,247,835 people shows a poor negative correlation between the proportion of Cubans and percentage of population with a disability under the age of 5 in the United States with a correlation coefficient (R) of -0.118 and weighted average of 1.2%. Similarly, the statistical analysis conducted on geographies consisting of 55,866,061 people shows a substantial positive correlation between the proportion of Immigrants from North Macedonia and percentage of population with a disability under the age of 5 in the United States with a correlation coefficient (R) of 0.563 and weighted average of 1.3%, a difference of 0.74%.
Disability Age Under 5 Correlation Summary
| Measurement | Cuban | Immigrants from North Macedonia |
| Minimum | 0.29% | 0.65% |
| Maximum | 3.9% | 4.4% |
| Range | 3.6% | 3.7% |
| Mean | 1.5% | 1.9% |
| Median | 1.4% | 1.5% |
| Interquartile 25% (IQ1) | 0.66% | 0.99% |
| Interquartile 75% (IQ3) | 1.8% | 2.6% |
| Interquartile Range (IQR) | 1.1% | 1.6% |
| Standard Deviation (Sample) | 0.93% | 1.1% |
| Standard Deviation (Population) | 0.92% | 1.1% |
Demographics Similar to Cubans and Immigrants from North Macedonia by Disability Age Under 5
In terms of disability age under 5, the demographic groups most similar to Cubans are Immigrants from Western Africa (1.2%, a difference of 0.0%), Palestinian (1.2%, a difference of 0.050%), Immigrants from Saudi Arabia (1.2%, a difference of 0.080%), Immigrants from Peru (1.2%, a difference of 0.12%), and Macedonian (1.2%, a difference of 0.12%). Similarly, the demographic groups most similar to Immigrants from North Macedonia are U.S. Virgin Islander (1.3%, a difference of 0.020%), Mexican American Indian (1.3%, a difference of 0.18%), Immigrants from Bosnia and Herzegovina (1.3%, a difference of 0.18%), Immigrants from Sierra Leone (1.3%, a difference of 0.18%), and Immigrants from Laos (1.3%, a difference of 0.19%).
| Demographics | Rating | Rank | Disability Age Under 5 |
| Immigrants | Mexico | 44.4 /100 | #180 | Average 1.2% |
| Immigrants | Peru | 43.7 /100 | #181 | Average 1.2% |
| Macedonians | 43.7 /100 | #181 | Average 1.2% |
| Immigrants | Saudi Arabia | 43.3 /100 | #183 | Average 1.2% |
| Palestinians | 43.0 /100 | #184 | Average 1.2% |
| Immigrants | Western Africa | 42.5 /100 | #185 | Average 1.2% |
| Cubans | 42.5 /100 | #186 | Average 1.2% |
| Immigrants | Haiti | 40.2 /100 | #187 | Average 1.3% |
| Haitians | 39.9 /100 | #188 | Fair 1.3% |
| Peruvians | 37.6 /100 | #189 | Fair 1.3% |
| Immigrants | Laos | 36.6 /100 | #190 | Fair 1.3% |
| Mexican American Indians | 36.6 /100 | #191 | Fair 1.3% |
| Immigrants | Bosnia and Herzegovina | 36.5 /100 | #192 | Fair 1.3% |
| Immigrants | Sierra Leone | 36.5 /100 | #193 | Fair 1.3% |
| Immigrants | North Macedonia | 34.7 /100 | #194 | Fair 1.3% |
| U.S. Virgin Islanders | 34.4 /100 | #195 | Fair 1.3% |
| Immigrants | Belgium | 31.4 /100 | #196 | Fair 1.3% |
| Immigrants | Somalia | 31.3 /100 | #197 | Fair 1.3% |
| Immigrants | Norway | 31.1 /100 | #198 | Fair 1.3% |
| Jamaicans | 30.7 /100 | #199 | Fair 1.3% |
| Immigrants | Lithuania | 27.2 /100 | #200 | Fair 1.3% |