Cuban vs Finnish College, 1 year or more
COMPARE
Cuban
Finnish
College, 1 year or more
College, 1 year or more Comparison
Cubans
Finns
53.4%
COLLEGE, 1 YEAR OR MORE
0.0/ 100
METRIC RATING
291st/ 347
METRIC RANK
60.2%
COLLEGE, 1 YEAR OR MORE
72.9/ 100
METRIC RATING
156th/ 347
METRIC RANK
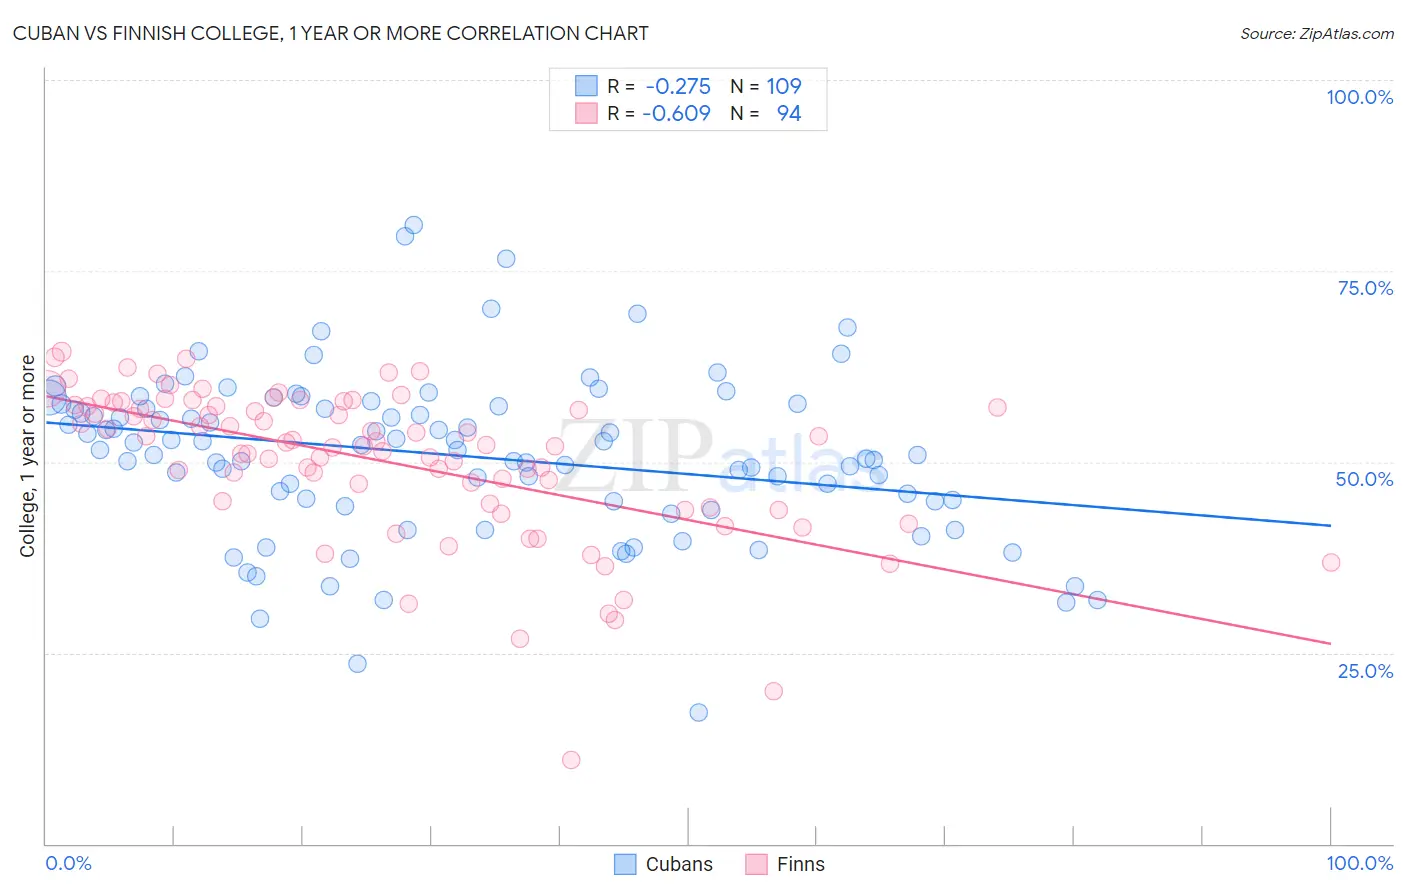
Cuban vs Finnish College, 1 year or more Correlation Chart
The statistical analysis conducted on geographies consisting of 449,372,622 people shows a weak negative correlation between the proportion of Cubans and percentage of population with at least college, 1 year or more education in the United States with a correlation coefficient (R) of -0.275 and weighted average of 53.4%. Similarly, the statistical analysis conducted on geographies consisting of 404,673,514 people shows a significant negative correlation between the proportion of Finns and percentage of population with at least college, 1 year or more education in the United States with a correlation coefficient (R) of -0.609 and weighted average of 60.2%, a difference of 12.8%.
College, 1 year or more Correlation Summary
| Measurement | Cuban | Finnish |
| Minimum | 17.3% | 11.0% |
| Maximum | 81.0% | 64.4% |
| Range | 63.7% | 53.4% |
| Mean | 50.8% | 50.1% |
| Median | 51.5% | 52.3% |
| Interquartile 25% (IQ1) | 44.8% | 44.5% |
| Interquartile 75% (IQ3) | 57.4% | 57.3% |
| Interquartile Range (IQR) | 12.6% | 12.8% |
| Standard Deviation (Sample) | 10.8% | 10.0% |
| Standard Deviation (Population) | 10.8% | 9.9% |
Similar Demographics by College, 1 year or more
Demographics Similar to Cubans by College, 1 year or more
In terms of college, 1 year or more, the demographic groups most similar to Cubans are Alaskan Athabascan (53.4%, a difference of 0.050%), Alaska Native (53.4%, a difference of 0.070%), Immigrants from Ecuador (53.4%, a difference of 0.070%), Chickasaw (53.3%, a difference of 0.13%), and Black/African American (53.3%, a difference of 0.15%).
| Demographics | Rating | Rank | College, 1 year or more |
| Ute | 0.1 /100 | #284 | Tragic 53.8% |
| Immigrants | Guyana | 0.1 /100 | #285 | Tragic 53.5% |
| Central American Indians | 0.1 /100 | #286 | Tragic 53.5% |
| Immigrants | Belize | 0.1 /100 | #287 | Tragic 53.5% |
| Alaska Natives | 0.0 /100 | #288 | Tragic 53.4% |
| Immigrants | Ecuador | 0.0 /100 | #289 | Tragic 53.4% |
| Alaskan Athabascans | 0.0 /100 | #290 | Tragic 53.4% |
| Cubans | 0.0 /100 | #291 | Tragic 53.4% |
| Chickasaw | 0.0 /100 | #292 | Tragic 53.3% |
| Blacks/African Americans | 0.0 /100 | #293 | Tragic 53.3% |
| Cherokee | 0.0 /100 | #294 | Tragic 53.2% |
| Yaqui | 0.0 /100 | #295 | Tragic 53.2% |
| Sioux | 0.0 /100 | #296 | Tragic 53.0% |
| Paiute | 0.0 /100 | #297 | Tragic 52.9% |
| Immigrants | Dominica | 0.0 /100 | #298 | Tragic 52.5% |
Demographics Similar to Finns by College, 1 year or more
In terms of college, 1 year or more, the demographic groups most similar to Finns are Sudanese (60.2%, a difference of 0.0%), Moroccan (60.2%, a difference of 0.0%), Sierra Leonean (60.2%, a difference of 0.080%), Immigrants from Germany (60.3%, a difference of 0.22%), and Immigrants from Armenia (60.0%, a difference of 0.26%).
| Demographics | Rating | Rank | College, 1 year or more |
| Brazilians | 79.0 /100 | #149 | Good 60.5% |
| Immigrants | Sudan | 77.8 /100 | #150 | Good 60.4% |
| Albanians | 77.8 /100 | #151 | Good 60.4% |
| Immigrants | Germany | 76.1 /100 | #152 | Good 60.3% |
| Sierra Leoneans | 74.1 /100 | #153 | Good 60.2% |
| Sudanese | 73.0 /100 | #154 | Good 60.2% |
| Moroccans | 72.9 /100 | #155 | Good 60.2% |
| Finns | 72.9 /100 | #156 | Good 60.2% |
| Immigrants | Armenia | 68.8 /100 | #157 | Good 60.0% |
| English | 67.2 /100 | #158 | Good 60.0% |
| Immigrants | Iraq | 67.0 /100 | #159 | Good 60.0% |
| South American Indians | 66.9 /100 | #160 | Good 60.0% |
| Somalis | 64.5 /100 | #161 | Good 59.9% |
| Koreans | 58.5 /100 | #162 | Average 59.7% |
| Immigrants | Somalia | 58.3 /100 | #163 | Average 59.7% |