Cuban vs Immigrants from Brazil Disability Age Under 5
COMPARE
Cuban
Immigrants from Brazil
Disability Age Under 5
Disability Age Under 5 Comparison
Cubans
Immigrants from Brazil
1.2%
DISABILITY AGE UNDER 5
42.5/ 100
METRIC RATING
186th/ 347
METRIC RANK
1.4%
DISABILITY AGE UNDER 5
0.7/ 100
METRIC RATING
254th/ 347
METRIC RANK
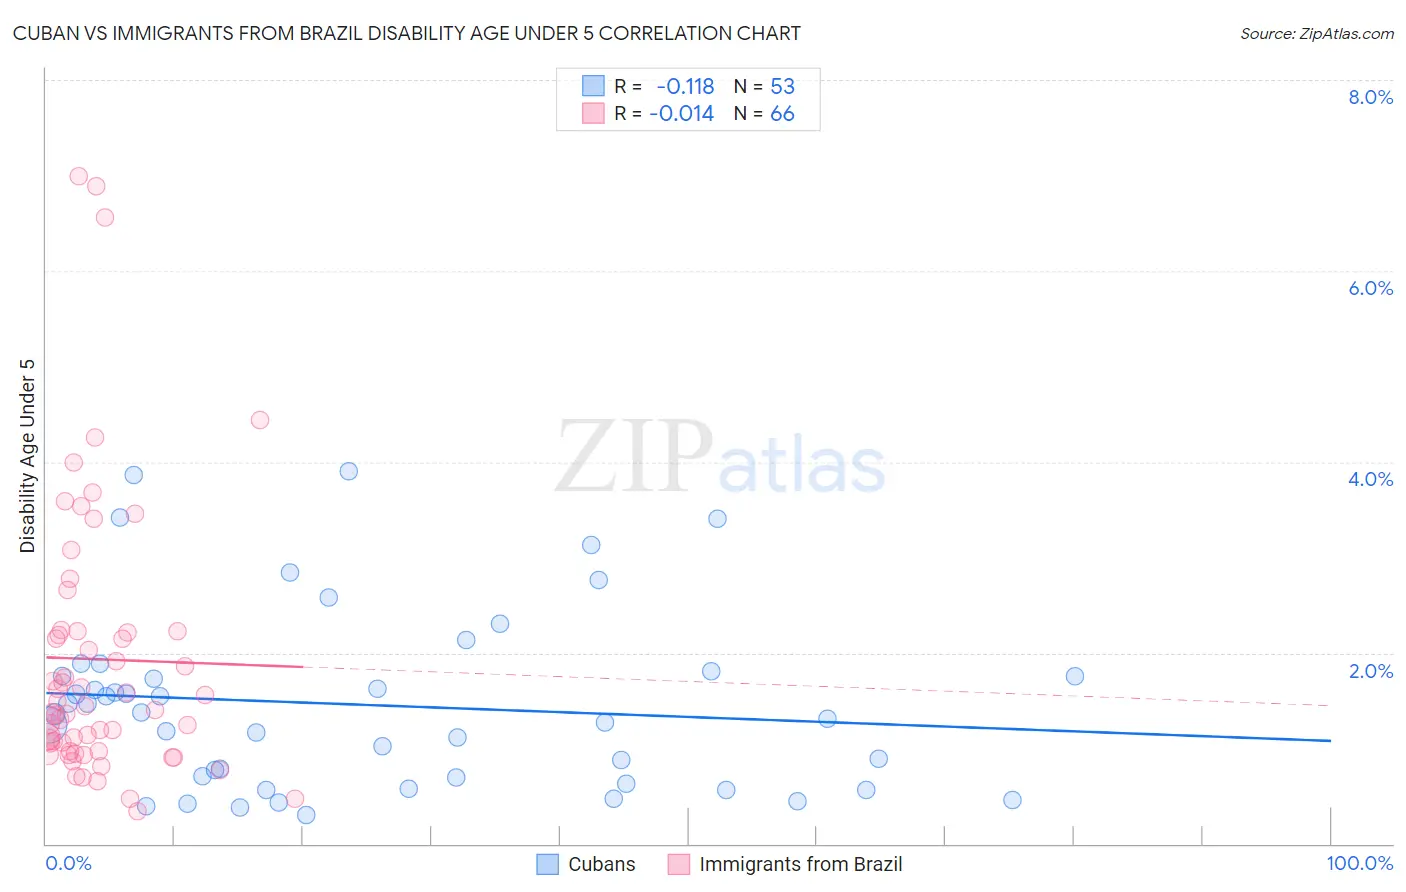
Cuban vs Immigrants from Brazil Disability Age Under 5 Correlation Chart
The statistical analysis conducted on geographies consisting of 234,247,835 people shows a poor negative correlation between the proportion of Cubans and percentage of population with a disability under the age of 5 in the United States with a correlation coefficient (R) of -0.118 and weighted average of 1.2%. Similarly, the statistical analysis conducted on geographies consisting of 192,252,216 people shows no correlation between the proportion of Immigrants from Brazil and percentage of population with a disability under the age of 5 in the United States with a correlation coefficient (R) of -0.014 and weighted average of 1.4%, a difference of 10.6%.
Disability Age Under 5 Correlation Summary
| Measurement | Cuban | Immigrants from Brazil |
| Minimum | 0.29% | 0.34% |
| Maximum | 3.9% | 7.0% |
| Range | 3.6% | 6.7% |
| Mean | 1.5% | 1.9% |
| Median | 1.4% | 1.4% |
| Interquartile 25% (IQ1) | 0.66% | 0.98% |
| Interquartile 75% (IQ3) | 1.8% | 2.2% |
| Interquartile Range (IQR) | 1.1% | 1.2% |
| Standard Deviation (Sample) | 0.93% | 1.4% |
| Standard Deviation (Population) | 0.92% | 1.4% |
Similar Demographics by Disability Age Under 5
Demographics Similar to Cubans by Disability Age Under 5
In terms of disability age under 5, the demographic groups most similar to Cubans are Immigrants from Western Africa (1.2%, a difference of 0.0%), Palestinian (1.2%, a difference of 0.050%), Immigrants from Saudi Arabia (1.2%, a difference of 0.080%), Macedonian (1.2%, a difference of 0.12%), and Immigrants from Peru (1.2%, a difference of 0.12%).
| Demographics | Rating | Rank | Disability Age Under 5 |
| Immigrants | Bahamas | 45.2 /100 | #179 | Average 1.2% |
| Immigrants | Mexico | 44.4 /100 | #180 | Average 1.2% |
| Macedonians | 43.7 /100 | #181 | Average 1.2% |
| Immigrants | Peru | 43.7 /100 | #181 | Average 1.2% |
| Immigrants | Saudi Arabia | 43.3 /100 | #183 | Average 1.2% |
| Palestinians | 43.0 /100 | #184 | Average 1.2% |
| Immigrants | Western Africa | 42.5 /100 | #185 | Average 1.2% |
| Cubans | 42.5 /100 | #186 | Average 1.2% |
| Immigrants | Haiti | 40.2 /100 | #187 | Average 1.3% |
| Haitians | 39.9 /100 | #188 | Fair 1.3% |
| Peruvians | 37.6 /100 | #189 | Fair 1.3% |
| Immigrants | Laos | 36.6 /100 | #190 | Fair 1.3% |
| Mexican American Indians | 36.6 /100 | #191 | Fair 1.3% |
| Immigrants | Bosnia and Herzegovina | 36.5 /100 | #192 | Fair 1.3% |
| Immigrants | Sierra Leone | 36.5 /100 | #193 | Fair 1.3% |
Demographics Similar to Immigrants from Brazil by Disability Age Under 5
In terms of disability age under 5, the demographic groups most similar to Immigrants from Brazil are Immigrants from Liberia (1.4%, a difference of 0.060%), Australian (1.4%, a difference of 0.080%), Immigrants from Western Europe (1.4%, a difference of 0.48%), Immigrants from Scotland (1.4%, a difference of 0.76%), and Immigrants from Hungary (1.4%, a difference of 0.80%).
| Demographics | Rating | Rank | Disability Age Under 5 |
| Immigrants | England | 1.0 /100 | #247 | Tragic 1.4% |
| Eastern Europeans | 1.0 /100 | #248 | Tragic 1.4% |
| Bermudans | 1.0 /100 | #249 | Tragic 1.4% |
| Africans | 1.0 /100 | #250 | Tragic 1.4% |
| Immigrants | Hungary | 1.0 /100 | #251 | Tragic 1.4% |
| Immigrants | Scotland | 0.9 /100 | #252 | Tragic 1.4% |
| Australians | 0.7 /100 | #253 | Tragic 1.4% |
| Immigrants | Brazil | 0.7 /100 | #254 | Tragic 1.4% |
| Immigrants | Liberia | 0.6 /100 | #255 | Tragic 1.4% |
| Immigrants | Western Europe | 0.5 /100 | #256 | Tragic 1.4% |
| Slovenes | 0.3 /100 | #257 | Tragic 1.4% |
| Costa Ricans | 0.3 /100 | #258 | Tragic 1.4% |
| Immigrants | Southern Europe | 0.3 /100 | #259 | Tragic 1.4% |
| Slavs | 0.3 /100 | #260 | Tragic 1.4% |
| Immigrants | Netherlands | 0.2 /100 | #261 | Tragic 1.4% |