Cuban vs Puget Sound Salish Disability Age Under 5
COMPARE
Cuban
Puget Sound Salish
Disability Age Under 5
Disability Age Under 5 Comparison
Cubans
Puget Sound Salish
1.2%
DISABILITY AGE UNDER 5
42.5/ 100
METRIC RATING
186th/ 347
METRIC RANK
0.97%
DISABILITY AGE UNDER 5
100.0/ 100
METRIC RATING
19th/ 347
METRIC RANK
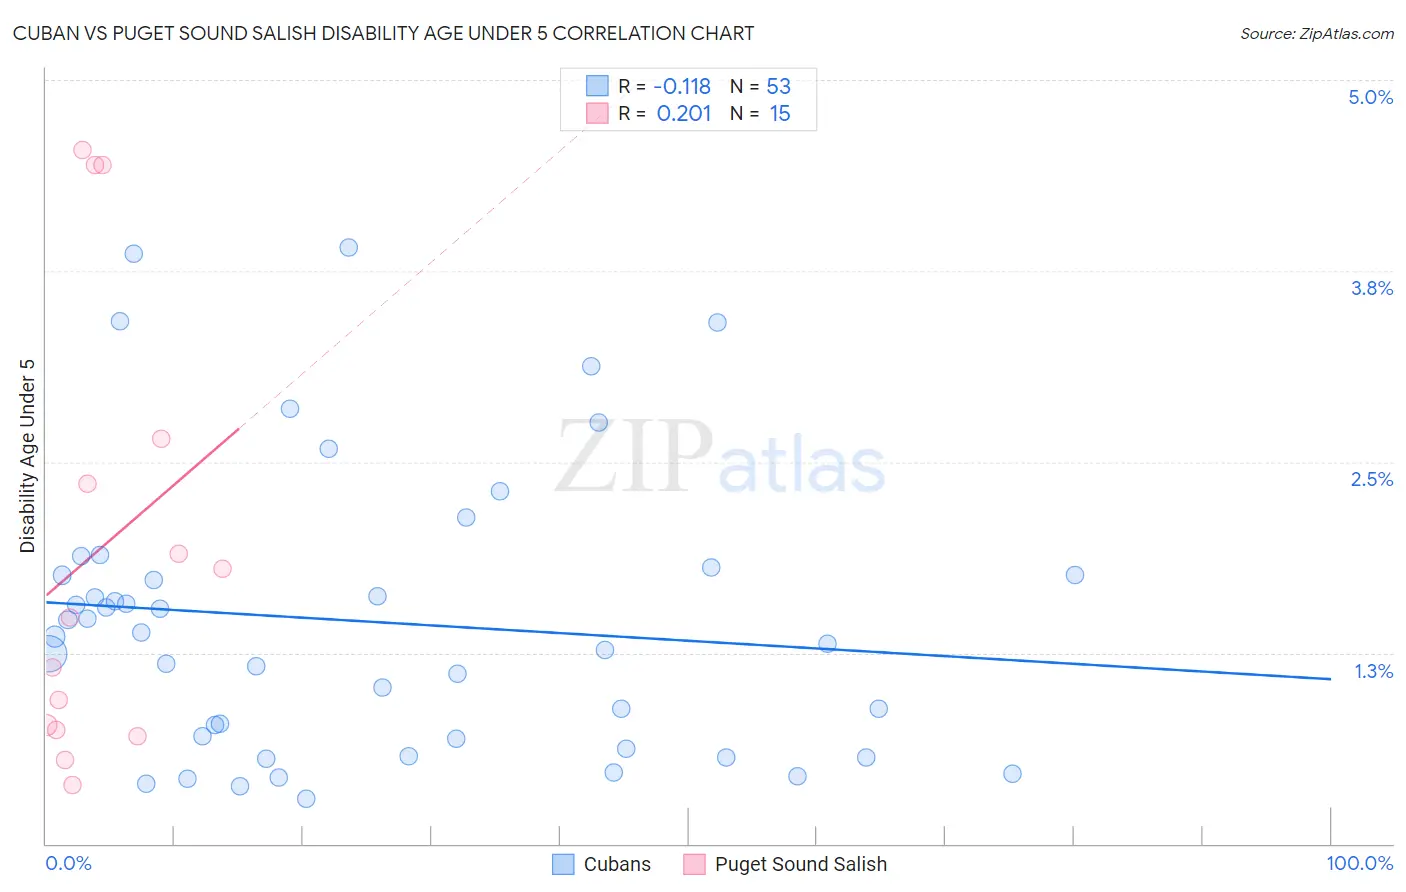
Cuban vs Puget Sound Salish Disability Age Under 5 Correlation Chart
The statistical analysis conducted on geographies consisting of 234,247,835 people shows a poor negative correlation between the proportion of Cubans and percentage of population with a disability under the age of 5 in the United States with a correlation coefficient (R) of -0.118 and weighted average of 1.2%. Similarly, the statistical analysis conducted on geographies consisting of 36,173,931 people shows a weak positive correlation between the proportion of Puget Sound Salish and percentage of population with a disability under the age of 5 in the United States with a correlation coefficient (R) of 0.201 and weighted average of 0.97%, a difference of 28.5%.
Disability Age Under 5 Correlation Summary
| Measurement | Cuban | Puget Sound Salish |
| Minimum | 0.29% | 0.38% |
| Maximum | 3.9% | 4.5% |
| Range | 3.6% | 4.2% |
| Mean | 1.5% | 1.9% |
| Median | 1.4% | 1.5% |
| Interquartile 25% (IQ1) | 0.66% | 0.75% |
| Interquartile 75% (IQ3) | 1.8% | 2.7% |
| Interquartile Range (IQR) | 1.1% | 1.9% |
| Standard Deviation (Sample) | 0.93% | 1.5% |
| Standard Deviation (Population) | 0.92% | 1.4% |
Similar Demographics by Disability Age Under 5
Demographics Similar to Cubans by Disability Age Under 5
In terms of disability age under 5, the demographic groups most similar to Cubans are Immigrants from Western Africa (1.2%, a difference of 0.0%), Palestinian (1.2%, a difference of 0.050%), Immigrants from Saudi Arabia (1.2%, a difference of 0.080%), Macedonian (1.2%, a difference of 0.12%), and Immigrants from Peru (1.2%, a difference of 0.12%).
| Demographics | Rating | Rank | Disability Age Under 5 |
| Immigrants | Bahamas | 45.2 /100 | #179 | Average 1.2% |
| Immigrants | Mexico | 44.4 /100 | #180 | Average 1.2% |
| Macedonians | 43.7 /100 | #181 | Average 1.2% |
| Immigrants | Peru | 43.7 /100 | #181 | Average 1.2% |
| Immigrants | Saudi Arabia | 43.3 /100 | #183 | Average 1.2% |
| Palestinians | 43.0 /100 | #184 | Average 1.2% |
| Immigrants | Western Africa | 42.5 /100 | #185 | Average 1.2% |
| Cubans | 42.5 /100 | #186 | Average 1.2% |
| Immigrants | Haiti | 40.2 /100 | #187 | Average 1.3% |
| Haitians | 39.9 /100 | #188 | Fair 1.3% |
| Peruvians | 37.6 /100 | #189 | Fair 1.3% |
| Immigrants | Laos | 36.6 /100 | #190 | Fair 1.3% |
| Mexican American Indians | 36.6 /100 | #191 | Fair 1.3% |
| Immigrants | Bosnia and Herzegovina | 36.5 /100 | #192 | Fair 1.3% |
| Immigrants | Sierra Leone | 36.5 /100 | #193 | Fair 1.3% |
Demographics Similar to Puget Sound Salish by Disability Age Under 5
In terms of disability age under 5, the demographic groups most similar to Puget Sound Salish are Nepalese (0.97%, a difference of 0.10%), Immigrants from Barbados (0.97%, a difference of 0.37%), Immigrants from China (0.96%, a difference of 0.95%), Immigrants from Israel (0.96%, a difference of 1.4%), and British West Indian (0.99%, a difference of 1.9%).
| Demographics | Rating | Rank | Disability Age Under 5 |
| Immigrants | Grenada | 100.0 /100 | #12 | Exceptional 0.94% |
| Soviet Union | 100.0 /100 | #13 | Exceptional 0.95% |
| Yuman | 100.0 /100 | #14 | Exceptional 0.95% |
| Immigrants | Hong Kong | 100.0 /100 | #15 | Exceptional 0.95% |
| Immigrants | Israel | 100.0 /100 | #16 | Exceptional 0.96% |
| Immigrants | China | 100.0 /100 | #17 | Exceptional 0.96% |
| Immigrants | Barbados | 100.0 /100 | #18 | Exceptional 0.97% |
| Puget Sound Salish | 100.0 /100 | #19 | Exceptional 0.97% |
| Nepalese | 100.0 /100 | #20 | Exceptional 0.97% |
| British West Indians | 100.0 /100 | #21 | Exceptional 0.99% |
| Immigrants | Iran | 100.0 /100 | #22 | Exceptional 1.00% |
| Yakama | 100.0 /100 | #23 | Exceptional 1.00% |
| Indians (Asian) | 100.0 /100 | #24 | Exceptional 1.0% |
| Immigrants | Micronesia | 100.0 /100 | #25 | Exceptional 1.0% |
| Immigrants | Taiwan | 100.0 /100 | #26 | Exceptional 1.0% |