Alaskan Athabascan vs Palestinian Self-Care Disability
COMPARE
Alaskan Athabascan
Palestinian
Self-Care Disability
Self-Care Disability Comparison
Alaskan Athabascans
Palestinians
2.5%
SELF-CARE DISABILITY
10.4/ 100
METRIC RATING
206th/ 347
METRIC RANK
2.3%
SELF-CARE DISABILITY
99.4/ 100
METRIC RATING
61st/ 347
METRIC RANK
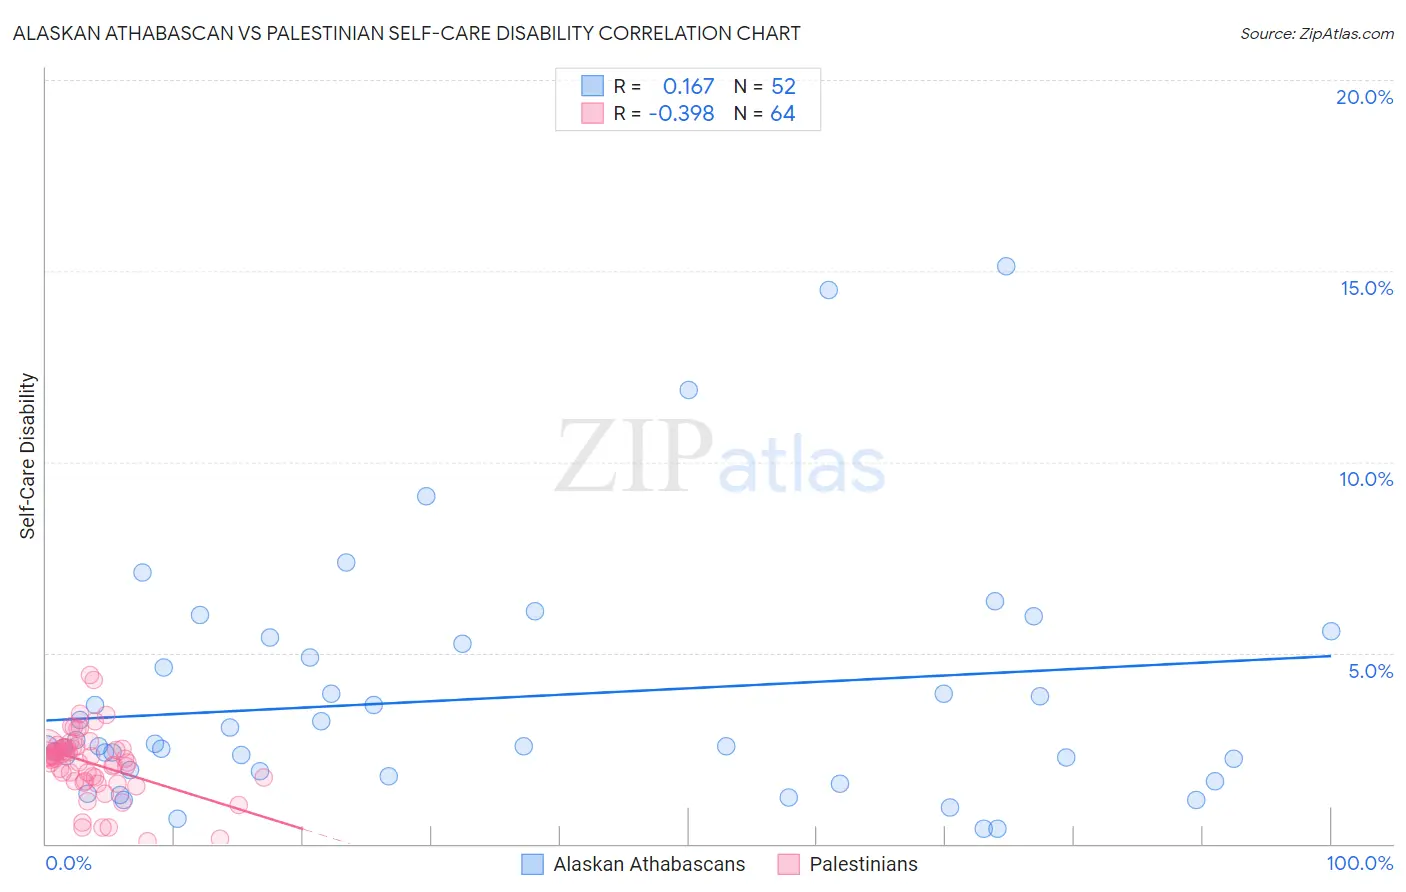
Alaskan Athabascan vs Palestinian Self-Care Disability Correlation Chart
The statistical analysis conducted on geographies consisting of 45,796,895 people shows a poor positive correlation between the proportion of Alaskan Athabascans and percentage of population with self-care disability in the United States with a correlation coefficient (R) of 0.167 and weighted average of 2.5%. Similarly, the statistical analysis conducted on geographies consisting of 216,359,093 people shows a mild negative correlation between the proportion of Palestinians and percentage of population with self-care disability in the United States with a correlation coefficient (R) of -0.398 and weighted average of 2.3%, a difference of 9.3%.
Self-Care Disability Correlation Summary
| Measurement | Alaskan Athabascan | Palestinian |
| Minimum | 0.38% | 0.076% |
| Maximum | 15.1% | 4.4% |
| Range | 14.7% | 4.3% |
| Mean | 3.8% | 2.1% |
| Median | 2.6% | 2.3% |
| Interquartile 25% (IQ1) | 1.9% | 1.7% |
| Interquartile 75% (IQ3) | 5.0% | 2.5% |
| Interquartile Range (IQR) | 3.1% | 0.83% |
| Standard Deviation (Sample) | 3.2% | 0.86% |
| Standard Deviation (Population) | 3.1% | 0.85% |
Similar Demographics by Self-Care Disability
Demographics Similar to Alaskan Athabascans by Self-Care Disability
In terms of self-care disability, the demographic groups most similar to Alaskan Athabascans are French (2.5%, a difference of 0.060%), Immigrants from Russia (2.5%, a difference of 0.080%), Immigrants from Bahamas (2.5%, a difference of 0.18%), Central American (2.5%, a difference of 0.23%), and Immigrants from Lebanon (2.5%, a difference of 0.24%).
| Demographics | Rating | Rank | Self-Care Disability |
| Immigrants | Ghana | 14.7 /100 | #199 | Poor 2.5% |
| Immigrants | Western Africa | 13.3 /100 | #200 | Poor 2.5% |
| Immigrants | South Eastern Asia | 12.9 /100 | #201 | Poor 2.5% |
| Slovaks | 12.6 /100 | #202 | Poor 2.5% |
| Immigrants | Lebanon | 12.4 /100 | #203 | Poor 2.5% |
| Immigrants | Bahamas | 11.9 /100 | #204 | Poor 2.5% |
| Immigrants | Russia | 11.0 /100 | #205 | Poor 2.5% |
| Alaskan Athabascans | 10.4 /100 | #206 | Poor 2.5% |
| French | 9.9 /100 | #207 | Tragic 2.5% |
| Central Americans | 8.7 /100 | #208 | Tragic 2.5% |
| Malaysians | 7.7 /100 | #209 | Tragic 2.5% |
| Panamanians | 6.4 /100 | #210 | Tragic 2.5% |
| Native Hawaiians | 5.1 /100 | #211 | Tragic 2.6% |
| Samoans | 5.1 /100 | #212 | Tragic 2.6% |
| Ecuadorians | 4.7 /100 | #213 | Tragic 2.6% |
Demographics Similar to Palestinians by Self-Care Disability
In terms of self-care disability, the demographic groups most similar to Palestinians are Egyptian (2.3%, a difference of 0.090%), Immigrants from Japan (2.3%, a difference of 0.10%), Mongolian (2.3%, a difference of 0.18%), Swedish (2.3%, a difference of 0.18%), and New Zealander (2.3%, a difference of 0.24%).
| Demographics | Rating | Rank | Self-Care Disability |
| Argentineans | 99.6 /100 | #54 | Exceptional 2.3% |
| Immigrants | France | 99.6 /100 | #55 | Exceptional 2.3% |
| Immigrants | Eastern Asia | 99.6 /100 | #56 | Exceptional 2.3% |
| Immigrants | Belgium | 99.6 /100 | #57 | Exceptional 2.3% |
| Immigrants | Cameroon | 99.6 /100 | #58 | Exceptional 2.3% |
| New Zealanders | 99.5 /100 | #59 | Exceptional 2.3% |
| Immigrants | Japan | 99.5 /100 | #60 | Exceptional 2.3% |
| Palestinians | 99.4 /100 | #61 | Exceptional 2.3% |
| Egyptians | 99.4 /100 | #62 | Exceptional 2.3% |
| Mongolians | 99.3 /100 | #63 | Exceptional 2.3% |
| Swedes | 99.3 /100 | #64 | Exceptional 2.3% |
| Brazilians | 99.3 /100 | #65 | Exceptional 2.3% |
| Immigrants | Argentina | 99.3 /100 | #66 | Exceptional 2.3% |
| South Africans | 99.3 /100 | #67 | Exceptional 2.3% |
| Immigrants | Zaire | 99.2 /100 | #68 | Exceptional 2.3% |