Croatian vs Immigrants from Australia Self-Care Disability
COMPARE
Croatian
Immigrants from Australia
Self-Care Disability
Self-Care Disability Comparison
Croatians
Immigrants from Australia
2.4%
SELF-CARE DISABILITY
95.0/ 100
METRIC RATING
102nd/ 347
METRIC RANK
2.3%
SELF-CARE DISABILITY
99.9/ 100
METRIC RATING
35th/ 347
METRIC RANK
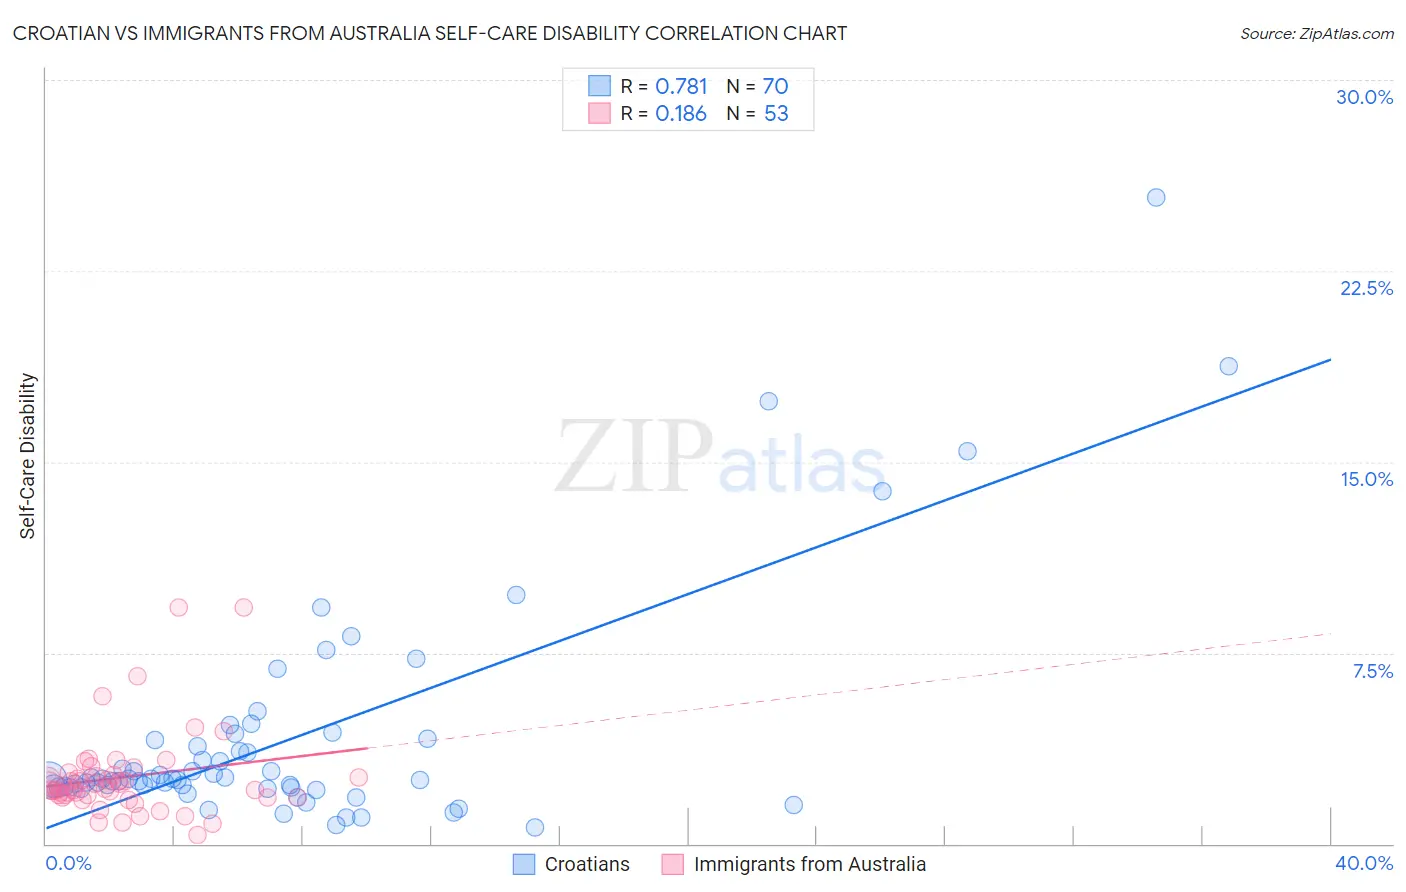
Croatian vs Immigrants from Australia Self-Care Disability Correlation Chart
The statistical analysis conducted on geographies consisting of 375,273,101 people shows a strong positive correlation between the proportion of Croatians and percentage of population with self-care disability in the United States with a correlation coefficient (R) of 0.781 and weighted average of 2.4%. Similarly, the statistical analysis conducted on geographies consisting of 227,025,526 people shows a poor positive correlation between the proportion of Immigrants from Australia and percentage of population with self-care disability in the United States with a correlation coefficient (R) of 0.186 and weighted average of 2.3%, a difference of 5.0%.
Self-Care Disability Correlation Summary
| Measurement | Croatian | Immigrants from Australia |
| Minimum | 0.62% | 0.32% |
| Maximum | 25.4% | 9.3% |
| Range | 24.8% | 9.0% |
| Mean | 4.1% | 2.6% |
| Median | 2.5% | 2.2% |
| Interquartile 25% (IQ1) | 2.2% | 1.8% |
| Interquartile 75% (IQ3) | 4.1% | 2.7% |
| Interquartile Range (IQR) | 1.9% | 0.93% |
| Standard Deviation (Sample) | 4.5% | 1.7% |
| Standard Deviation (Population) | 4.4% | 1.7% |
Similar Demographics by Self-Care Disability
Demographics Similar to Croatians by Self-Care Disability
In terms of self-care disability, the demographic groups most similar to Croatians are Alsatian (2.4%, a difference of 0.030%), Bhutanese (2.4%, a difference of 0.13%), Carpatho Rusyn (2.4%, a difference of 0.17%), Immigrants from Scotland (2.4%, a difference of 0.18%), and Immigrants from Indonesia (2.4%, a difference of 0.18%).
| Demographics | Rating | Rank | Self-Care Disability |
| Immigrants | Asia | 96.9 /100 | #95 | Exceptional 2.4% |
| Immigrants | Chile | 96.7 /100 | #96 | Exceptional 2.4% |
| Swiss | 96.6 /100 | #97 | Exceptional 2.4% |
| Immigrants | Poland | 96.4 /100 | #98 | Exceptional 2.4% |
| Immigrants | Israel | 96.1 /100 | #99 | Exceptional 2.4% |
| Europeans | 95.8 /100 | #100 | Exceptional 2.4% |
| Immigrants | Scotland | 95.7 /100 | #101 | Exceptional 2.4% |
| Croatians | 95.0 /100 | #102 | Exceptional 2.4% |
| Alsatians | 94.9 /100 | #103 | Exceptional 2.4% |
| Bhutanese | 94.5 /100 | #104 | Exceptional 2.4% |
| Carpatho Rusyns | 94.4 /100 | #105 | Exceptional 2.4% |
| Immigrants | Indonesia | 94.3 /100 | #106 | Exceptional 2.4% |
| British | 94.3 /100 | #107 | Exceptional 2.4% |
| Greeks | 94.1 /100 | #108 | Exceptional 2.4% |
| Slovenes | 94.1 /100 | #109 | Exceptional 2.4% |
Demographics Similar to Immigrants from Australia by Self-Care Disability
In terms of self-care disability, the demographic groups most similar to Immigrants from Australia are Immigrants from Lithuania (2.3%, a difference of 0.010%), Immigrants from Turkey (2.3%, a difference of 0.060%), Immigrants from Korea (2.3%, a difference of 0.12%), Immigrants from Sweden (2.3%, a difference of 0.18%), and Immigrants from Eastern Africa (2.3%, a difference of 0.31%).
| Demographics | Rating | Rank | Self-Care Disability |
| Inupiat | 99.9 /100 | #28 | Exceptional 2.2% |
| Immigrants | Zimbabwe | 99.9 /100 | #29 | Exceptional 2.3% |
| Paraguayans | 99.9 /100 | #30 | Exceptional 2.3% |
| Danes | 99.9 /100 | #31 | Exceptional 2.3% |
| Burmese | 99.9 /100 | #32 | Exceptional 2.3% |
| Immigrants | Korea | 99.9 /100 | #33 | Exceptional 2.3% |
| Immigrants | Turkey | 99.9 /100 | #34 | Exceptional 2.3% |
| Immigrants | Australia | 99.9 /100 | #35 | Exceptional 2.3% |
| Immigrants | Lithuania | 99.9 /100 | #36 | Exceptional 2.3% |
| Immigrants | Sweden | 99.9 /100 | #37 | Exceptional 2.3% |
| Immigrants | Eastern Africa | 99.9 /100 | #38 | Exceptional 2.3% |
| Immigrants | Bulgaria | 99.8 /100 | #39 | Exceptional 2.3% |
| Iranians | 99.8 /100 | #40 | Exceptional 2.3% |
| Immigrants | Sudan | 99.8 /100 | #41 | Exceptional 2.3% |
| Immigrants | Uganda | 99.8 /100 | #42 | Exceptional 2.3% |