Chippewa vs Immigrants from El Salvador Female Disability
COMPARE
Chippewa
Immigrants from El Salvador
Female Disability
Female Disability Comparison
Chippewa
Immigrants from El Salvador
14.0%
FEMALE DISABILITY
0.0/ 100
METRIC RATING
317th/ 347
METRIC RANK
11.4%
FEMALE DISABILITY
99.9/ 100
METRIC RATING
64th/ 347
METRIC RANK
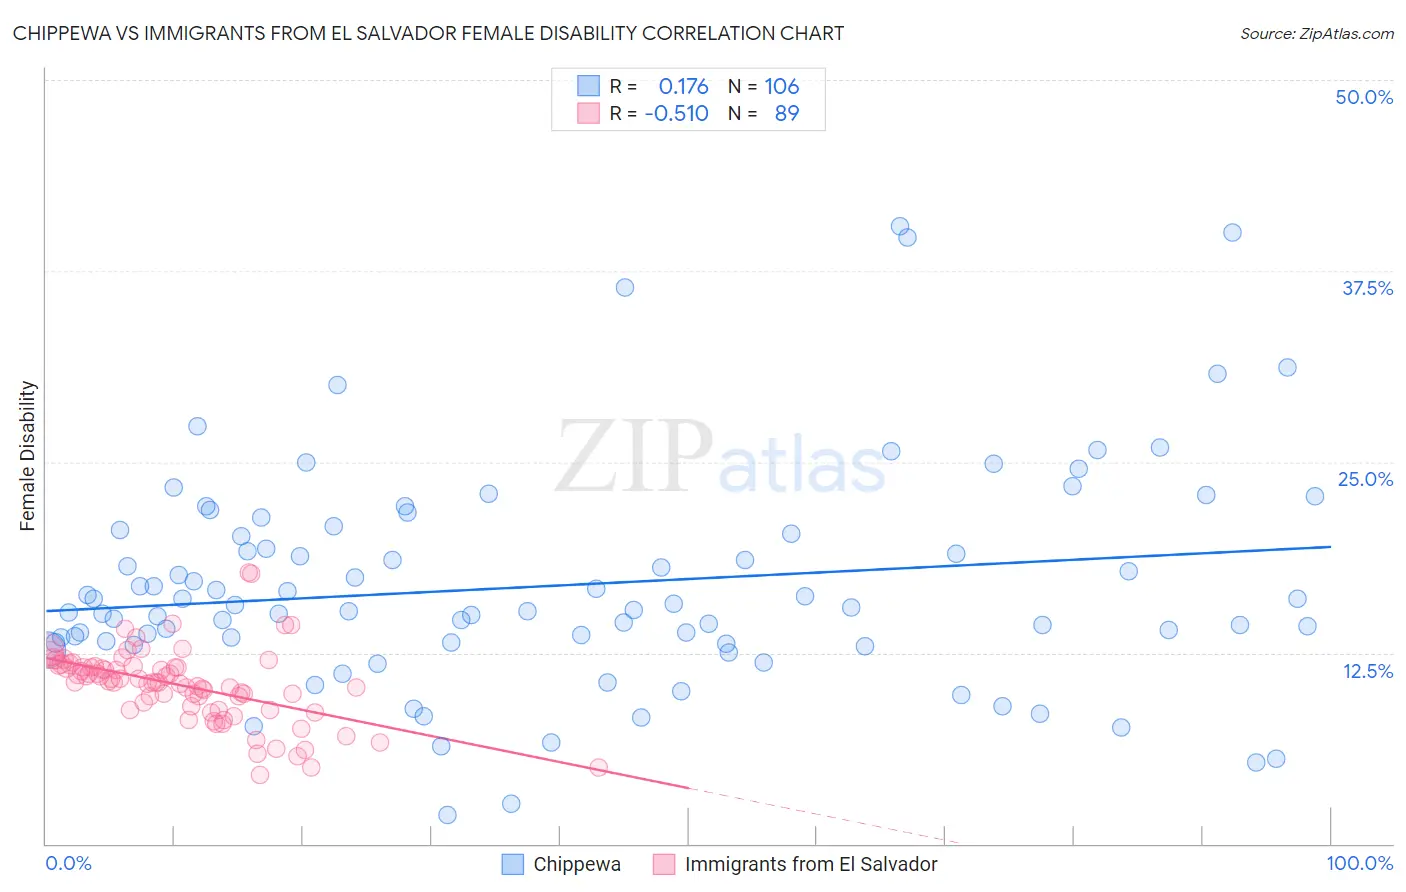
Chippewa vs Immigrants from El Salvador Female Disability Correlation Chart
The statistical analysis conducted on geographies consisting of 215,042,988 people shows a poor positive correlation between the proportion of Chippewa and percentage of females with a disability in the United States with a correlation coefficient (R) of 0.176 and weighted average of 14.0%. Similarly, the statistical analysis conducted on geographies consisting of 357,763,756 people shows a substantial negative correlation between the proportion of Immigrants from El Salvador and percentage of females with a disability in the United States with a correlation coefficient (R) of -0.510 and weighted average of 11.4%, a difference of 22.3%.
Female Disability Correlation Summary
| Measurement | Chippewa | Immigrants from El Salvador |
| Minimum | 1.9% | 4.5% |
| Maximum | 40.4% | 17.7% |
| Range | 38.5% | 13.2% |
| Mean | 16.9% | 10.4% |
| Median | 15.4% | 10.6% |
| Interquartile 25% (IQ1) | 13.1% | 8.9% |
| Interquartile 75% (IQ3) | 20.3% | 11.6% |
| Interquartile Range (IQR) | 7.2% | 2.7% |
| Standard Deviation (Sample) | 7.2% | 2.4% |
| Standard Deviation (Population) | 7.2% | 2.4% |
Similar Demographics by Female Disability
Demographics Similar to Chippewa by Female Disability
In terms of female disability, the demographic groups most similar to Chippewa are Spanish American (14.0%, a difference of 0.11%), Paiute (14.0%, a difference of 0.11%), Iroquois (14.0%, a difference of 0.40%), Alaskan Athabascan (13.9%, a difference of 0.47%), and American (14.1%, a difference of 0.74%).
| Demographics | Rating | Rank | Female Disability |
| Apache | 0.0 /100 | #310 | Tragic 13.7% |
| Hopi | 0.0 /100 | #311 | Tragic 13.7% |
| Delaware | 0.0 /100 | #312 | Tragic 13.8% |
| Blackfeet | 0.0 /100 | #313 | Tragic 13.8% |
| Puget Sound Salish | 0.0 /100 | #314 | Tragic 13.8% |
| Alaskan Athabascans | 0.0 /100 | #315 | Tragic 13.9% |
| Spanish Americans | 0.0 /100 | #316 | Tragic 14.0% |
| Chippewa | 0.0 /100 | #317 | Tragic 14.0% |
| Paiute | 0.0 /100 | #318 | Tragic 14.0% |
| Iroquois | 0.0 /100 | #319 | Tragic 14.0% |
| Americans | 0.0 /100 | #320 | Tragic 14.1% |
| Potawatomi | 0.0 /100 | #321 | Tragic 14.1% |
| Pueblo | 0.0 /100 | #322 | Tragic 14.1% |
| Blacks/African Americans | 0.0 /100 | #323 | Tragic 14.1% |
| Natives/Alaskans | 0.0 /100 | #324 | Tragic 14.1% |
Demographics Similar to Immigrants from El Salvador by Female Disability
In terms of female disability, the demographic groups most similar to Immigrants from El Salvador are Immigrants from South America (11.4%, a difference of 0.020%), Immigrants from Colombia (11.4%, a difference of 0.070%), Sri Lankan (11.4%, a difference of 0.17%), Salvadoran (11.5%, a difference of 0.19%), and Immigrants from Vietnam (11.5%, a difference of 0.24%).
| Demographics | Rating | Rank | Female Disability |
| South Americans | 99.9 /100 | #57 | Exceptional 11.4% |
| Laotians | 99.9 /100 | #58 | Exceptional 11.4% |
| Immigrants | Spain | 99.9 /100 | #59 | Exceptional 11.4% |
| Immigrants | Bulgaria | 99.9 /100 | #60 | Exceptional 11.4% |
| Immigrants | France | 99.9 /100 | #61 | Exceptional 11.4% |
| Sri Lankans | 99.9 /100 | #62 | Exceptional 11.4% |
| Immigrants | Colombia | 99.9 /100 | #63 | Exceptional 11.4% |
| Immigrants | El Salvador | 99.9 /100 | #64 | Exceptional 11.4% |
| Immigrants | South America | 99.9 /100 | #65 | Exceptional 11.4% |
| Salvadorans | 99.8 /100 | #66 | Exceptional 11.5% |
| Immigrants | Vietnam | 99.8 /100 | #67 | Exceptional 11.5% |
| Immigrants | Northern Africa | 99.8 /100 | #68 | Exceptional 11.5% |
| Colombians | 99.8 /100 | #69 | Exceptional 11.5% |
| Immigrants | Chile | 99.8 /100 | #70 | Exceptional 11.5% |
| Immigrants | Ireland | 99.8 /100 | #71 | Exceptional 11.5% |