Chippewa vs Immigrants from Uruguay Female Disability
COMPARE
Chippewa
Immigrants from Uruguay
Female Disability
Female Disability Comparison
Chippewa
Immigrants from Uruguay
14.0%
FEMALE DISABILITY
0.0/ 100
METRIC RATING
317th/ 347
METRIC RANK
11.7%
FEMALE DISABILITY
98.5/ 100
METRIC RATING
100th/ 347
METRIC RANK
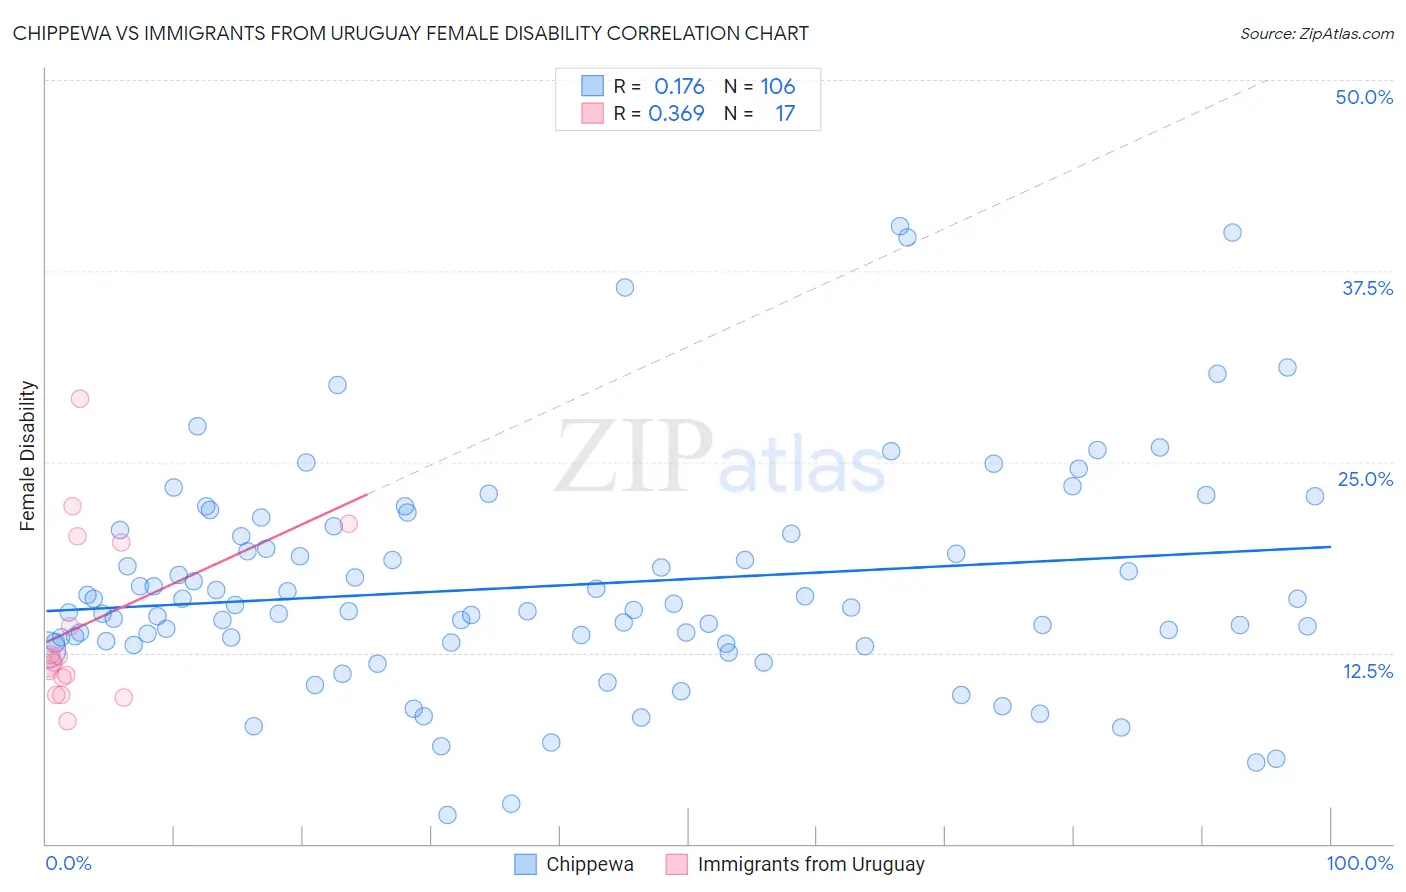
Chippewa vs Immigrants from Uruguay Female Disability Correlation Chart
The statistical analysis conducted on geographies consisting of 215,042,988 people shows a poor positive correlation between the proportion of Chippewa and percentage of females with a disability in the United States with a correlation coefficient (R) of 0.176 and weighted average of 14.0%. Similarly, the statistical analysis conducted on geographies consisting of 133,256,548 people shows a mild positive correlation between the proportion of Immigrants from Uruguay and percentage of females with a disability in the United States with a correlation coefficient (R) of 0.369 and weighted average of 11.7%, a difference of 19.4%.
Female Disability Correlation Summary
| Measurement | Chippewa | Immigrants from Uruguay |
| Minimum | 1.9% | 8.0% |
| Maximum | 40.4% | 29.1% |
| Range | 38.5% | 21.1% |
| Mean | 16.9% | 14.4% |
| Median | 15.4% | 11.9% |
| Interquartile 25% (IQ1) | 13.1% | 10.3% |
| Interquartile 75% (IQ3) | 20.3% | 19.9% |
| Interquartile Range (IQR) | 7.2% | 9.6% |
| Standard Deviation (Sample) | 7.2% | 5.8% |
| Standard Deviation (Population) | 7.2% | 5.6% |
Similar Demographics by Female Disability
Demographics Similar to Chippewa by Female Disability
In terms of female disability, the demographic groups most similar to Chippewa are Spanish American (14.0%, a difference of 0.11%), Paiute (14.0%, a difference of 0.11%), Iroquois (14.0%, a difference of 0.40%), Alaskan Athabascan (13.9%, a difference of 0.47%), and American (14.1%, a difference of 0.74%).
| Demographics | Rating | Rank | Female Disability |
| Apache | 0.0 /100 | #310 | Tragic 13.7% |
| Hopi | 0.0 /100 | #311 | Tragic 13.7% |
| Delaware | 0.0 /100 | #312 | Tragic 13.8% |
| Blackfeet | 0.0 /100 | #313 | Tragic 13.8% |
| Puget Sound Salish | 0.0 /100 | #314 | Tragic 13.8% |
| Alaskan Athabascans | 0.0 /100 | #315 | Tragic 13.9% |
| Spanish Americans | 0.0 /100 | #316 | Tragic 14.0% |
| Chippewa | 0.0 /100 | #317 | Tragic 14.0% |
| Paiute | 0.0 /100 | #318 | Tragic 14.0% |
| Iroquois | 0.0 /100 | #319 | Tragic 14.0% |
| Americans | 0.0 /100 | #320 | Tragic 14.1% |
| Potawatomi | 0.0 /100 | #321 | Tragic 14.1% |
| Pueblo | 0.0 /100 | #322 | Tragic 14.1% |
| Blacks/African Americans | 0.0 /100 | #323 | Tragic 14.1% |
| Natives/Alaskans | 0.0 /100 | #324 | Tragic 14.1% |
Demographics Similar to Immigrants from Uruguay by Female Disability
In terms of female disability, the demographic groups most similar to Immigrants from Uruguay are Immigrants from Costa Rica (11.7%, a difference of 0.020%), Immigrants from South Eastern Asia (11.7%, a difference of 0.030%), Immigrants from Philippines (11.7%, a difference of 0.050%), Immigrants from Eastern Africa (11.7%, a difference of 0.10%), and Immigrants from Western Asia (11.7%, a difference of 0.11%).
| Demographics | Rating | Rank | Female Disability |
| Immigrants | Sierra Leone | 99.4 /100 | #93 | Exceptional 11.6% |
| Immigrants | Brazil | 99.4 /100 | #94 | Exceptional 11.6% |
| Immigrants | Northern Europe | 99.4 /100 | #95 | Exceptional 11.6% |
| Immigrants | Russia | 99.0 /100 | #96 | Exceptional 11.7% |
| Koreans | 99.0 /100 | #97 | Exceptional 11.7% |
| Uruguayans | 98.8 /100 | #98 | Exceptional 11.7% |
| Immigrants | Philippines | 98.6 /100 | #99 | Exceptional 11.7% |
| Immigrants | Uruguay | 98.5 /100 | #100 | Exceptional 11.7% |
| Immigrants | Costa Rica | 98.4 /100 | #101 | Exceptional 11.7% |
| Immigrants | South Eastern Asia | 98.4 /100 | #102 | Exceptional 11.7% |
| Immigrants | Eastern Africa | 98.3 /100 | #103 | Exceptional 11.7% |
| Immigrants | Western Asia | 98.3 /100 | #104 | Exceptional 11.7% |
| Australians | 98.3 /100 | #105 | Exceptional 11.7% |
| Immigrants | Greece | 98.2 /100 | #106 | Exceptional 11.7% |
| Latvians | 98.2 /100 | #107 | Exceptional 11.7% |