Chippewa vs Panamanian Female Disability
COMPARE
Chippewa
Panamanian
Female Disability
Female Disability Comparison
Chippewa
Panamanians
14.0%
FEMALE DISABILITY
0.0/ 100
METRIC RATING
317th/ 347
METRIC RANK
12.4%
FEMALE DISABILITY
13.5/ 100
METRIC RATING
214th/ 347
METRIC RANK
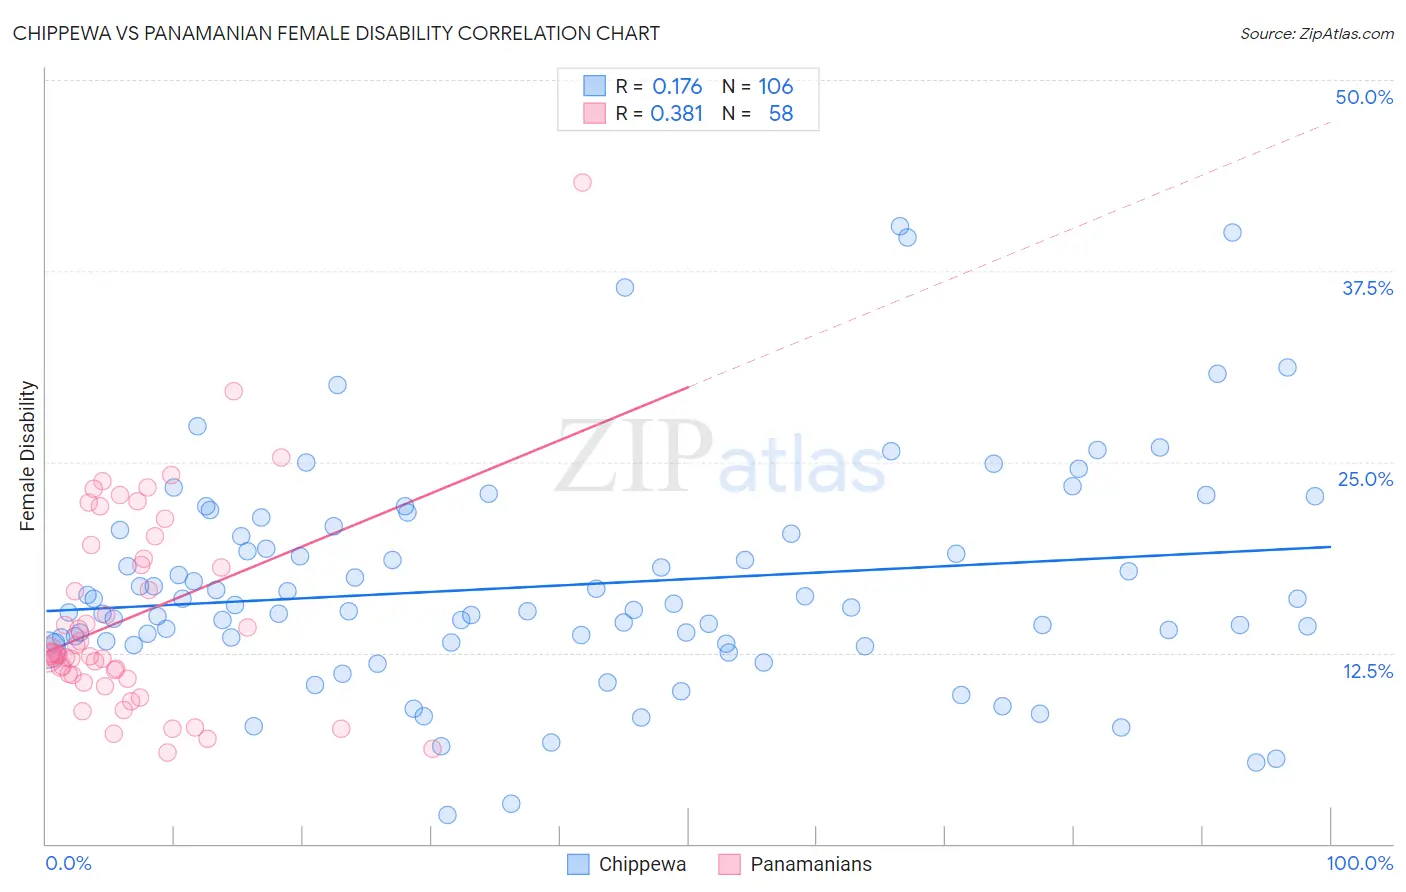
Chippewa vs Panamanian Female Disability Correlation Chart
The statistical analysis conducted on geographies consisting of 215,042,988 people shows a poor positive correlation between the proportion of Chippewa and percentage of females with a disability in the United States with a correlation coefficient (R) of 0.176 and weighted average of 14.0%. Similarly, the statistical analysis conducted on geographies consisting of 281,177,048 people shows a mild positive correlation between the proportion of Panamanians and percentage of females with a disability in the United States with a correlation coefficient (R) of 0.381 and weighted average of 12.4%, a difference of 12.8%.
Female Disability Correlation Summary
| Measurement | Chippewa | Panamanian |
| Minimum | 1.9% | 6.0% |
| Maximum | 40.4% | 43.3% |
| Range | 38.5% | 37.3% |
| Mean | 16.9% | 14.9% |
| Median | 15.4% | 12.4% |
| Interquartile 25% (IQ1) | 13.1% | 11.0% |
| Interquartile 75% (IQ3) | 20.3% | 18.6% |
| Interquartile Range (IQR) | 7.2% | 7.6% |
| Standard Deviation (Sample) | 7.2% | 6.7% |
| Standard Deviation (Population) | 7.2% | 6.7% |
Similar Demographics by Female Disability
Demographics Similar to Chippewa by Female Disability
In terms of female disability, the demographic groups most similar to Chippewa are Spanish American (14.0%, a difference of 0.11%), Paiute (14.0%, a difference of 0.11%), Iroquois (14.0%, a difference of 0.40%), Alaskan Athabascan (13.9%, a difference of 0.47%), and American (14.1%, a difference of 0.74%).
| Demographics | Rating | Rank | Female Disability |
| Apache | 0.0 /100 | #310 | Tragic 13.7% |
| Hopi | 0.0 /100 | #311 | Tragic 13.7% |
| Delaware | 0.0 /100 | #312 | Tragic 13.8% |
| Blackfeet | 0.0 /100 | #313 | Tragic 13.8% |
| Puget Sound Salish | 0.0 /100 | #314 | Tragic 13.8% |
| Alaskan Athabascans | 0.0 /100 | #315 | Tragic 13.9% |
| Spanish Americans | 0.0 /100 | #316 | Tragic 14.0% |
| Chippewa | 0.0 /100 | #317 | Tragic 14.0% |
| Paiute | 0.0 /100 | #318 | Tragic 14.0% |
| Iroquois | 0.0 /100 | #319 | Tragic 14.0% |
| Americans | 0.0 /100 | #320 | Tragic 14.1% |
| Potawatomi | 0.0 /100 | #321 | Tragic 14.1% |
| Pueblo | 0.0 /100 | #322 | Tragic 14.1% |
| Blacks/African Americans | 0.0 /100 | #323 | Tragic 14.1% |
| Natives/Alaskans | 0.0 /100 | #324 | Tragic 14.1% |
Demographics Similar to Panamanians by Female Disability
In terms of female disability, the demographic groups most similar to Panamanians are Samoan (12.4%, a difference of 0.0%), Immigrants from Burma/Myanmar (12.4%, a difference of 0.010%), British (12.4%, a difference of 0.060%), Immigrants from Thailand (12.4%, a difference of 0.080%), and Immigrants from Bahamas (12.4%, a difference of 0.080%).
| Demographics | Rating | Rank | Female Disability |
| Croatians | 20.2 /100 | #207 | Fair 12.4% |
| Basques | 17.5 /100 | #208 | Poor 12.4% |
| Mexicans | 15.7 /100 | #209 | Poor 12.4% |
| Swiss | 14.9 /100 | #210 | Poor 12.4% |
| Immigrants | Bosnia and Herzegovina | 14.8 /100 | #211 | Poor 12.4% |
| Ute | 14.7 /100 | #212 | Poor 12.4% |
| Immigrants | Thailand | 14.5 /100 | #213 | Poor 12.4% |
| Panamanians | 13.5 /100 | #214 | Poor 12.4% |
| Samoans | 13.4 /100 | #215 | Poor 12.4% |
| Immigrants | Burma/Myanmar | 13.3 /100 | #216 | Poor 12.4% |
| British | 12.7 /100 | #217 | Poor 12.4% |
| Immigrants | Bahamas | 12.5 /100 | #218 | Poor 12.4% |
| Europeans | 12.1 /100 | #219 | Poor 12.4% |
| Bahamians | 11.1 /100 | #220 | Poor 12.4% |
| Native Hawaiians | 10.8 /100 | #221 | Poor 12.4% |