Chinese vs Immigrants from Chile Self-Care Disability
COMPARE
Chinese
Immigrants from Chile
Self-Care Disability
Self-Care Disability Comparison
Chinese
Immigrants from Chile
2.6%
SELF-CARE DISABILITY
2.9/ 100
METRIC RATING
226th/ 347
METRIC RANK
2.4%
SELF-CARE DISABILITY
96.7/ 100
METRIC RATING
96th/ 347
METRIC RANK
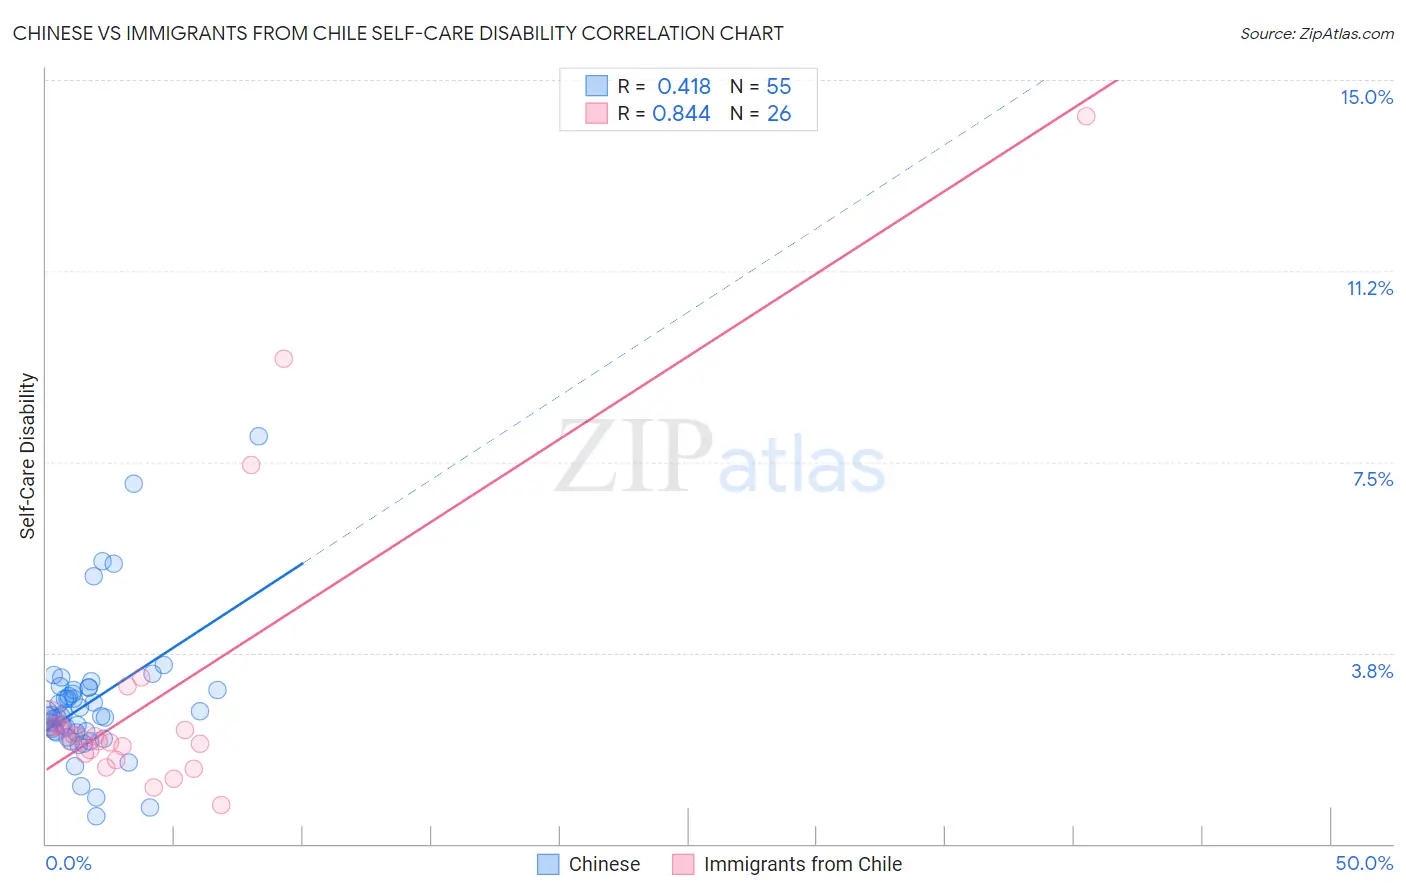
Chinese vs Immigrants from Chile Self-Care Disability Correlation Chart
The statistical analysis conducted on geographies consisting of 64,799,357 people shows a moderate positive correlation between the proportion of Chinese and percentage of population with self-care disability in the United States with a correlation coefficient (R) of 0.418 and weighted average of 2.6%. Similarly, the statistical analysis conducted on geographies consisting of 218,576,088 people shows a very strong positive correlation between the proportion of Immigrants from Chile and percentage of population with self-care disability in the United States with a correlation coefficient (R) of 0.844 and weighted average of 2.4%, a difference of 8.6%.
Self-Care Disability Correlation Summary
| Measurement | Chinese | Immigrants from Chile |
| Minimum | 0.55% | 0.76% |
| Maximum | 8.0% | 14.3% |
| Range | 7.4% | 13.5% |
| Mean | 2.8% | 3.0% |
| Median | 2.5% | 2.1% |
| Interquartile 25% (IQ1) | 2.2% | 1.8% |
| Interquartile 75% (IQ3) | 3.0% | 2.3% |
| Interquartile Range (IQR) | 0.82% | 0.58% |
| Standard Deviation (Sample) | 1.3% | 3.0% |
| Standard Deviation (Population) | 1.3% | 2.9% |
Similar Demographics by Self-Care Disability
Demographics Similar to Chinese by Self-Care Disability
In terms of self-care disability, the demographic groups most similar to Chinese are Immigrants from Philippines (2.6%, a difference of 0.080%), Guatemalan (2.6%, a difference of 0.090%), Iraqi (2.6%, a difference of 0.10%), Guamanian/Chamorro (2.6%, a difference of 0.16%), and Immigrants from Ecuador (2.6%, a difference of 0.16%).
| Demographics | Rating | Rank | Self-Care Disability |
| Immigrants | Moldova | 4.0 /100 | #219 | Tragic 2.6% |
| Sub-Saharan Africans | 4.0 /100 | #220 | Tragic 2.6% |
| Hondurans | 3.8 /100 | #221 | Tragic 2.6% |
| Spaniards | 3.8 /100 | #222 | Tragic 2.6% |
| French Canadians | 3.8 /100 | #223 | Tragic 2.6% |
| Osage | 3.6 /100 | #224 | Tragic 2.6% |
| Iraqis | 3.2 /100 | #225 | Tragic 2.6% |
| Chinese | 2.9 /100 | #226 | Tragic 2.6% |
| Immigrants | Philippines | 2.7 /100 | #227 | Tragic 2.6% |
| Guatemalans | 2.7 /100 | #228 | Tragic 2.6% |
| Guamanians/Chamorros | 2.5 /100 | #229 | Tragic 2.6% |
| Immigrants | Ecuador | 2.5 /100 | #230 | Tragic 2.6% |
| Immigrants | Guatemala | 2.2 /100 | #231 | Tragic 2.6% |
| Albanians | 2.2 /100 | #232 | Tragic 2.6% |
| Liberians | 2.1 /100 | #233 | Tragic 2.6% |
Demographics Similar to Immigrants from Chile by Self-Care Disability
In terms of self-care disability, the demographic groups most similar to Immigrants from Chile are Swiss (2.4%, a difference of 0.040%), Immigrants from Asia (2.4%, a difference of 0.060%), Macedonian (2.4%, a difference of 0.070%), Immigrants from Latvia (2.4%, a difference of 0.11%), and Immigrants from Poland (2.4%, a difference of 0.14%).
| Demographics | Rating | Rank | Self-Care Disability |
| Immigrants | Congo | 98.0 /100 | #89 | Exceptional 2.4% |
| Immigrants | Czechoslovakia | 97.7 /100 | #90 | Exceptional 2.4% |
| Immigrants | Jordan | 97.7 /100 | #91 | Exceptional 2.4% |
| Icelanders | 97.4 /100 | #92 | Exceptional 2.4% |
| Immigrants | Latvia | 97.0 /100 | #93 | Exceptional 2.4% |
| Macedonians | 96.9 /100 | #94 | Exceptional 2.4% |
| Immigrants | Asia | 96.9 /100 | #95 | Exceptional 2.4% |
| Immigrants | Chile | 96.7 /100 | #96 | Exceptional 2.4% |
| Swiss | 96.6 /100 | #97 | Exceptional 2.4% |
| Immigrants | Poland | 96.4 /100 | #98 | Exceptional 2.4% |
| Immigrants | Israel | 96.1 /100 | #99 | Exceptional 2.4% |
| Europeans | 95.8 /100 | #100 | Exceptional 2.4% |
| Immigrants | Scotland | 95.7 /100 | #101 | Exceptional 2.4% |
| Croatians | 95.0 /100 | #102 | Exceptional 2.4% |
| Alsatians | 94.9 /100 | #103 | Exceptional 2.4% |