Chilean vs Paiute Disability Age 5 to 17
COMPARE
Chilean
Paiute
Disability Age 5 to 17
Disability Age 5 to 17 Comparison
Chileans
Paiute
5.4%
DISABILITY AGE 5 TO 17
95.8/ 100
METRIC RATING
122nd/ 347
METRIC RANK
5.7%
DISABILITY AGE 5 TO 17
11.2/ 100
METRIC RATING
204th/ 347
METRIC RANK
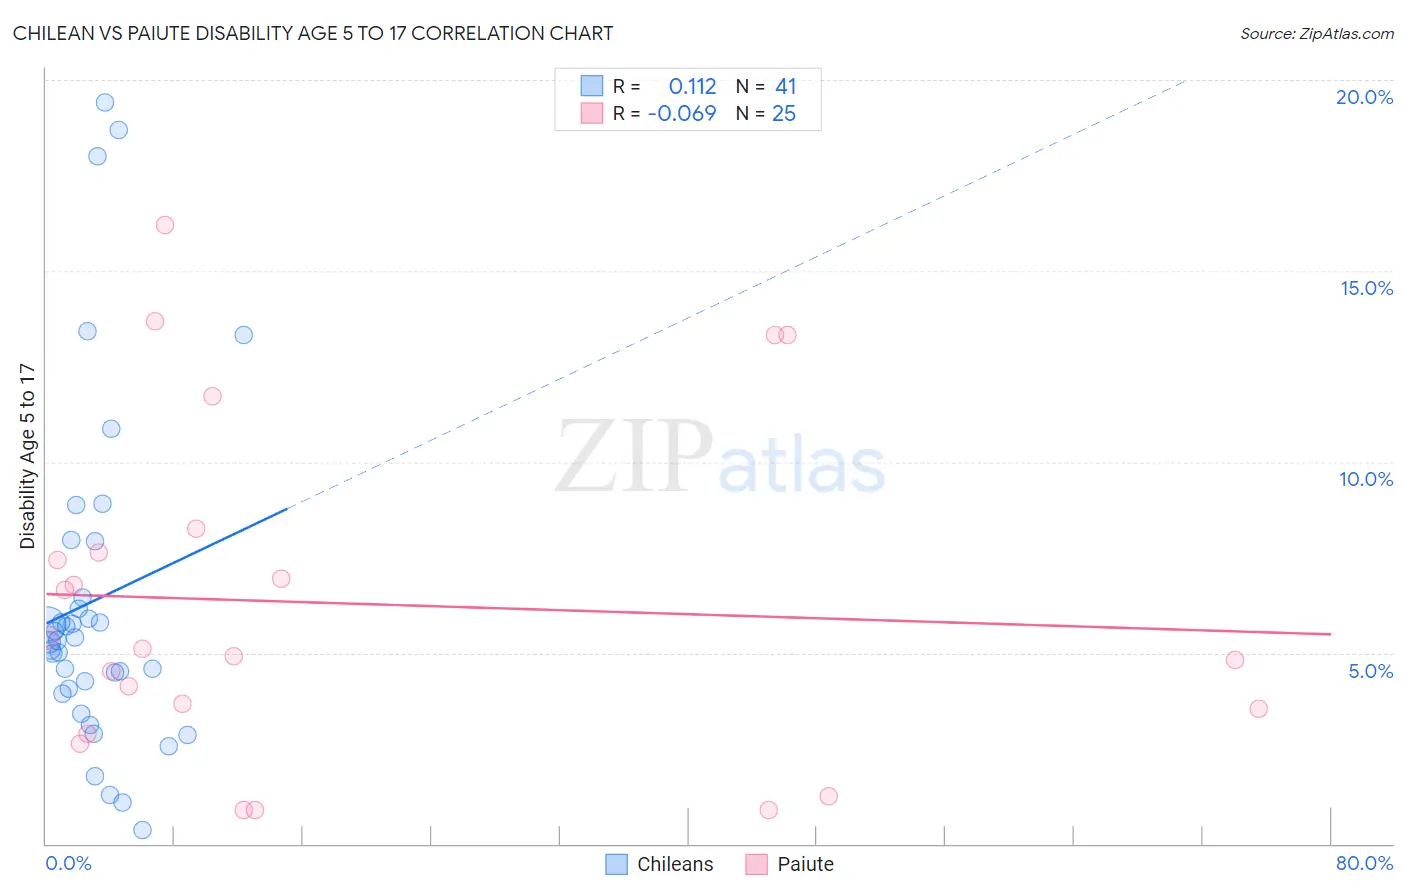
Chilean vs Paiute Disability Age 5 to 17 Correlation Chart
The statistical analysis conducted on geographies consisting of 255,519,515 people shows a poor positive correlation between the proportion of Chileans and percentage of population with a disability between the ages 5 and 17 in the United States with a correlation coefficient (R) of 0.112 and weighted average of 5.4%. Similarly, the statistical analysis conducted on geographies consisting of 58,225,397 people shows a slight negative correlation between the proportion of Paiute and percentage of population with a disability between the ages 5 and 17 in the United States with a correlation coefficient (R) of -0.069 and weighted average of 5.7%, a difference of 6.7%.
Disability Age 5 to 17 Correlation Summary
| Measurement | Chilean | Paiute |
| Minimum | 0.37% | 0.89% |
| Maximum | 19.4% | 16.2% |
| Range | 19.1% | 15.3% |
| Mean | 6.4% | 6.3% |
| Median | 5.3% | 5.1% |
| Interquartile 25% (IQ1) | 4.0% | 3.2% |
| Interquartile 75% (IQ3) | 7.2% | 7.9% |
| Interquartile Range (IQR) | 3.2% | 4.7% |
| Standard Deviation (Sample) | 4.5% | 4.4% |
| Standard Deviation (Population) | 4.4% | 4.3% |
Similar Demographics by Disability Age 5 to 17
Demographics Similar to Chileans by Disability Age 5 to 17
In terms of disability age 5 to 17, the demographic groups most similar to Chileans are Maltese (5.4%, a difference of 0.060%), Immigrants from Ethiopia (5.4%, a difference of 0.10%), Crow (5.4%, a difference of 0.23%), Immigrants from Chile (5.4%, a difference of 0.24%), and New Zealander (5.4%, a difference of 0.25%).
| Demographics | Rating | Rank | Disability Age 5 to 17 |
| Cubans | 97.8 /100 | #115 | Exceptional 5.3% |
| Cypriots | 97.7 /100 | #116 | Exceptional 5.3% |
| Immigrants | Afghanistan | 97.4 /100 | #117 | Exceptional 5.3% |
| South Americans | 97.1 /100 | #118 | Exceptional 5.4% |
| Immigrants | South America | 97.1 /100 | #119 | Exceptional 5.4% |
| Immigrants | Immigrants | 97.0 /100 | #120 | Exceptional 5.4% |
| Maltese | 96.0 /100 | #121 | Exceptional 5.4% |
| Chileans | 95.8 /100 | #122 | Exceptional 5.4% |
| Immigrants | Ethiopia | 95.5 /100 | #123 | Exceptional 5.4% |
| Crow | 95.0 /100 | #124 | Exceptional 5.4% |
| Immigrants | Chile | 95.0 /100 | #125 | Exceptional 5.4% |
| New Zealanders | 95.0 /100 | #126 | Exceptional 5.4% |
| Latvians | 95.0 /100 | #127 | Exceptional 5.4% |
| Immigrants | Venezuela | 94.5 /100 | #128 | Exceptional 5.4% |
| Romanians | 94.1 /100 | #129 | Exceptional 5.4% |
Demographics Similar to Paiute by Disability Age 5 to 17
In terms of disability age 5 to 17, the demographic groups most similar to Paiute are Trinidadian and Tobagonian (5.7%, a difference of 0.050%), Immigrants from Africa (5.7%, a difference of 0.060%), Moroccan (5.7%, a difference of 0.10%), Kenyan (5.8%, a difference of 0.15%), and Spanish American Indian (5.7%, a difference of 0.18%).
| Demographics | Rating | Rank | Disability Age 5 to 17 |
| Immigrants | North America | 23.1 /100 | #197 | Fair 5.7% |
| Norwegians | 20.9 /100 | #198 | Fair 5.7% |
| Northern Europeans | 15.2 /100 | #199 | Poor 5.7% |
| Icelanders | 14.6 /100 | #200 | Poor 5.7% |
| Basques | 13.7 /100 | #201 | Poor 5.7% |
| Austrians | 13.2 /100 | #202 | Poor 5.7% |
| Spanish American Indians | 12.8 /100 | #203 | Poor 5.7% |
| Paiute | 11.2 /100 | #204 | Poor 5.7% |
| Trinidadians and Tobagonians | 10.8 /100 | #205 | Poor 5.7% |
| Immigrants | Africa | 10.8 /100 | #206 | Poor 5.7% |
| Moroccans | 10.4 /100 | #207 | Poor 5.7% |
| Kenyans | 10.0 /100 | #208 | Poor 5.8% |
| Immigrants | Uganda | 9.7 /100 | #209 | Tragic 5.8% |
| Immigrants | Haiti | 9.5 /100 | #210 | Tragic 5.8% |
| Yugoslavians | 9.1 /100 | #211 | Tragic 5.8% |