Scottish vs Immigrants from Uganda Hearing Disability
COMPARE
Scottish
Immigrants from Uganda
Hearing Disability
Hearing Disability Comparison
Scottish
Immigrants from Uganda
3.7%
HEARING DISABILITY
0.0/ 100
METRIC RATING
300th/ 347
METRIC RANK
2.9%
HEARING DISABILITY
86.6/ 100
METRIC RATING
129th/ 347
METRIC RANK
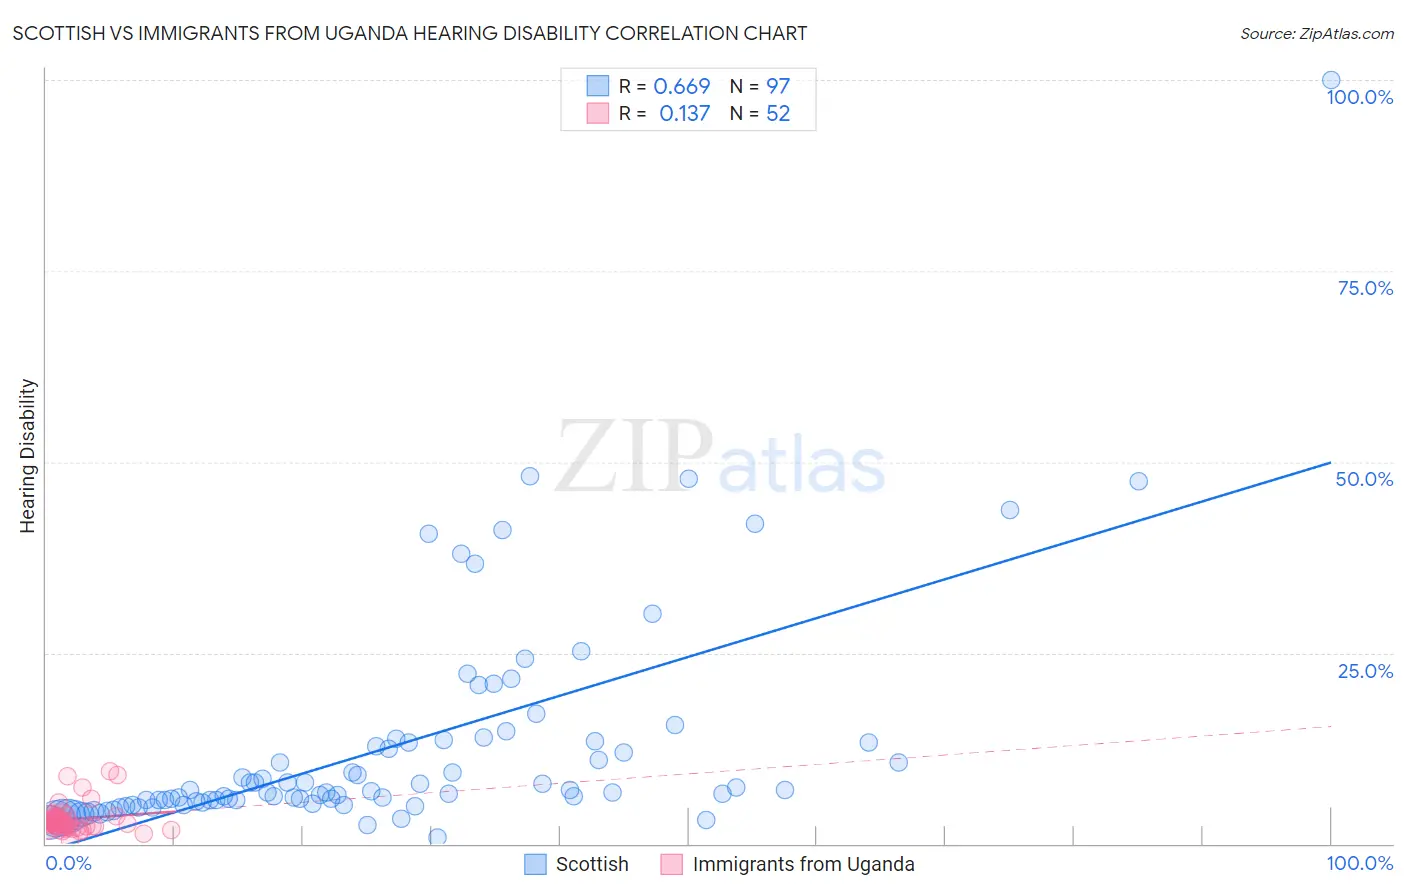
Scottish vs Immigrants from Uganda Hearing Disability Correlation Chart
The statistical analysis conducted on geographies consisting of 566,483,062 people shows a significant positive correlation between the proportion of Scottish and percentage of population with hearing disability in the United States with a correlation coefficient (R) of 0.669 and weighted average of 3.7%. Similarly, the statistical analysis conducted on geographies consisting of 125,979,149 people shows a poor positive correlation between the proportion of Immigrants from Uganda and percentage of population with hearing disability in the United States with a correlation coefficient (R) of 0.137 and weighted average of 2.9%, a difference of 30.4%.
Hearing Disability Correlation Summary
| Measurement | Scottish | Immigrants from Uganda |
| Minimum | 0.87% | 0.45% |
| Maximum | 100.0% | 9.4% |
| Range | 99.1% | 9.0% |
| Mean | 12.6% | 3.2% |
| Median | 6.8% | 2.8% |
| Interquartile 25% (IQ1) | 5.4% | 2.4% |
| Interquartile 75% (IQ3) | 13.4% | 3.3% |
| Interquartile Range (IQR) | 8.0% | 0.98% |
| Standard Deviation (Sample) | 14.5% | 1.8% |
| Standard Deviation (Population) | 14.4% | 1.8% |
Similar Demographics by Hearing Disability
Demographics Similar to Scottish by Hearing Disability
In terms of hearing disability, the demographic groups most similar to Scottish are Pennsylvania German (3.7%, a difference of 0.030%), German (3.7%, a difference of 0.060%), Dutch (3.7%, a difference of 0.13%), Menominee (3.7%, a difference of 0.19%), and Celtic (3.7%, a difference of 0.34%).
| Demographics | Rating | Rank | Hearing Disability |
| Norwegians | 0.0 /100 | #293 | Tragic 3.7% |
| Iroquois | 0.0 /100 | #294 | Tragic 3.7% |
| Welsh | 0.0 /100 | #295 | Tragic 3.7% |
| Pima | 0.0 /100 | #296 | Tragic 3.7% |
| Immigrants | Azores | 0.0 /100 | #297 | Tragic 3.7% |
| Celtics | 0.0 /100 | #298 | Tragic 3.7% |
| Germans | 0.0 /100 | #299 | Tragic 3.7% |
| Scottish | 0.0 /100 | #300 | Tragic 3.7% |
| Pennsylvania Germans | 0.0 /100 | #301 | Tragic 3.7% |
| Dutch | 0.0 /100 | #302 | Tragic 3.7% |
| Menominee | 0.0 /100 | #303 | Tragic 3.7% |
| French | 0.0 /100 | #304 | Tragic 3.8% |
| English | 0.0 /100 | #305 | Tragic 3.8% |
| Marshallese | 0.0 /100 | #306 | Tragic 3.8% |
| French Canadians | 0.0 /100 | #307 | Tragic 3.8% |
Demographics Similar to Immigrants from Uganda by Hearing Disability
In terms of hearing disability, the demographic groups most similar to Immigrants from Uganda are Immigrants from Vietnam (2.9%, a difference of 0.020%), South American Indian (2.9%, a difference of 0.050%), Immigrants from Western Asia (2.9%, a difference of 0.050%), Immigrants from Kenya (2.9%, a difference of 0.10%), and Chilean (2.9%, a difference of 0.16%).
| Demographics | Rating | Rank | Hearing Disability |
| Liberians | 89.0 /100 | #122 | Excellent 2.8% |
| Immigrants | Zaire | 88.6 /100 | #123 | Excellent 2.9% |
| Bahamians | 88.6 /100 | #124 | Excellent 2.9% |
| Immigrants | Albania | 88.5 /100 | #125 | Excellent 2.9% |
| Immigrants | Sudan | 87.8 /100 | #126 | Excellent 2.9% |
| South American Indians | 86.9 /100 | #127 | Excellent 2.9% |
| Immigrants | Western Asia | 86.9 /100 | #128 | Excellent 2.9% |
| Immigrants | Uganda | 86.6 /100 | #129 | Excellent 2.9% |
| Immigrants | Vietnam | 86.5 /100 | #130 | Excellent 2.9% |
| Immigrants | Kenya | 86.1 /100 | #131 | Excellent 2.9% |
| Chileans | 85.8 /100 | #132 | Excellent 2.9% |
| Immigrants | Syria | 85.8 /100 | #133 | Excellent 2.9% |
| Ugandans | 85.5 /100 | #134 | Excellent 2.9% |
| Soviet Union | 84.8 /100 | #135 | Excellent 2.9% |
| Immigrants | Brazil | 84.6 /100 | #136 | Excellent 2.9% |