Central American vs Immigrants from Uganda Hearing Disability
COMPARE
Central American
Immigrants from Uganda
Hearing Disability
Hearing Disability Comparison
Central Americans
Immigrants from Uganda
2.7%
HEARING DISABILITY
97.7/ 100
METRIC RATING
71st/ 347
METRIC RANK
2.9%
HEARING DISABILITY
86.6/ 100
METRIC RATING
129th/ 347
METRIC RANK
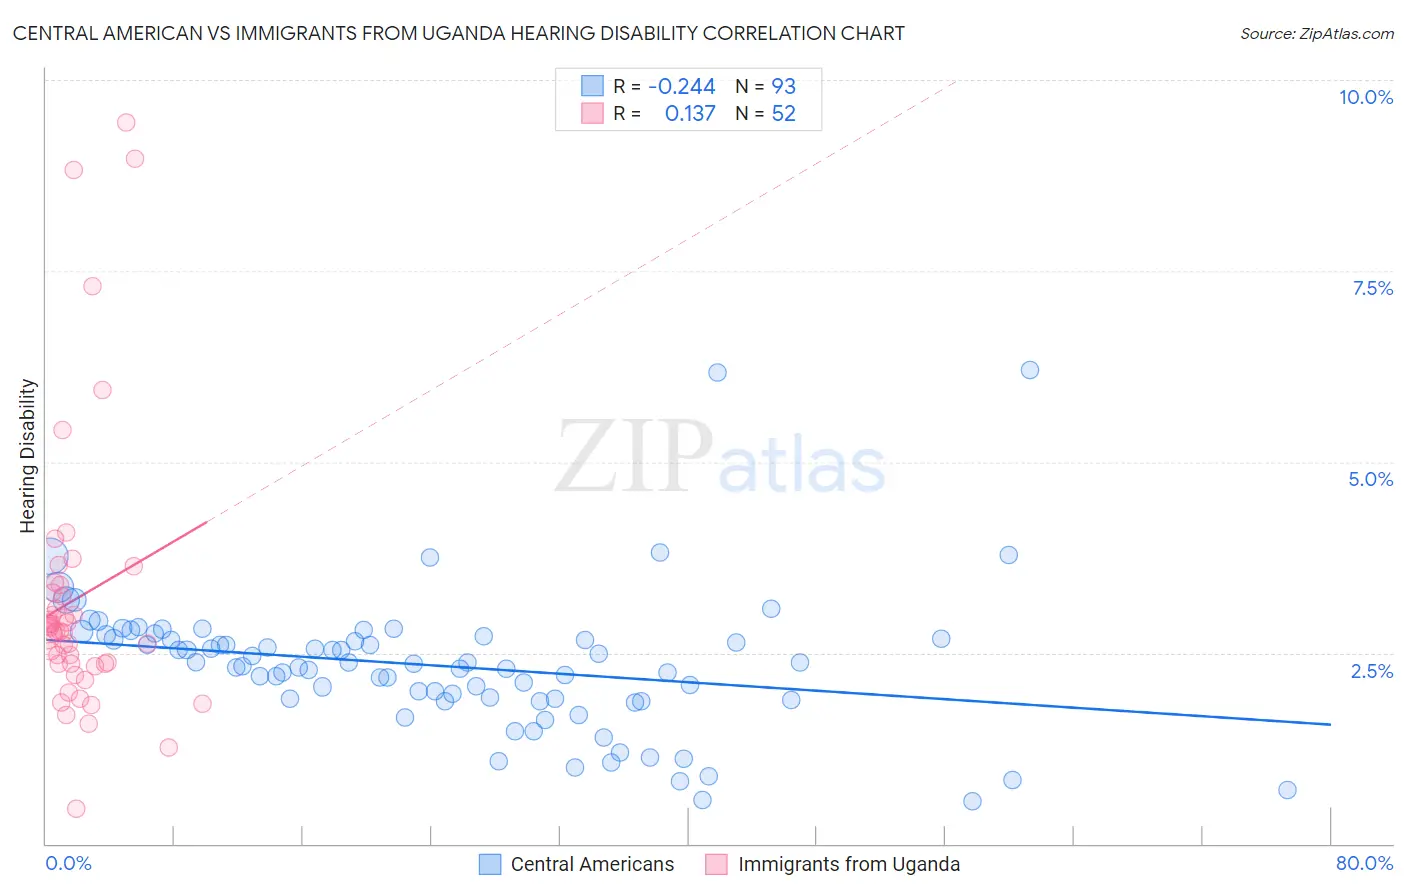
Central American vs Immigrants from Uganda Hearing Disability Correlation Chart
The statistical analysis conducted on geographies consisting of 504,204,845 people shows a weak negative correlation between the proportion of Central Americans and percentage of population with hearing disability in the United States with a correlation coefficient (R) of -0.244 and weighted average of 2.7%. Similarly, the statistical analysis conducted on geographies consisting of 125,979,149 people shows a poor positive correlation between the proportion of Immigrants from Uganda and percentage of population with hearing disability in the United States with a correlation coefficient (R) of 0.137 and weighted average of 2.9%, a difference of 4.8%.
Hearing Disability Correlation Summary
| Measurement | Central American | Immigrants from Uganda |
| Minimum | 0.55% | 0.45% |
| Maximum | 6.2% | 9.4% |
| Range | 5.7% | 9.0% |
| Mean | 2.3% | 3.2% |
| Median | 2.4% | 2.8% |
| Interquartile 25% (IQ1) | 1.9% | 2.4% |
| Interquartile 75% (IQ3) | 2.7% | 3.3% |
| Interquartile Range (IQR) | 0.81% | 0.98% |
| Standard Deviation (Sample) | 0.91% | 1.8% |
| Standard Deviation (Population) | 0.91% | 1.8% |
Similar Demographics by Hearing Disability
Demographics Similar to Central Americans by Hearing Disability
In terms of hearing disability, the demographic groups most similar to Central Americans are Peruvian (2.7%, a difference of 0.050%), Afghan (2.7%, a difference of 0.10%), Argentinean (2.7%, a difference of 0.18%), Immigrants from Korea (2.7%, a difference of 0.18%), and Immigrants from Saudi Arabia (2.7%, a difference of 0.21%).
| Demographics | Rating | Rank | Hearing Disability |
| Immigrants | Sri Lanka | 98.4 /100 | #64 | Exceptional 2.7% |
| Immigrants | Nepal | 98.3 /100 | #65 | Exceptional 2.7% |
| Immigrants | Belize | 98.2 /100 | #66 | Exceptional 2.7% |
| Egyptians | 98.1 /100 | #67 | Exceptional 2.7% |
| Immigrants | Africa | 98.0 /100 | #68 | Exceptional 2.7% |
| Nicaraguans | 97.9 /100 | #69 | Exceptional 2.7% |
| Peruvians | 97.7 /100 | #70 | Exceptional 2.7% |
| Central Americans | 97.7 /100 | #71 | Exceptional 2.7% |
| Afghans | 97.6 /100 | #72 | Exceptional 2.7% |
| Argentineans | 97.5 /100 | #73 | Exceptional 2.7% |
| Immigrants | Korea | 97.5 /100 | #74 | Exceptional 2.7% |
| Immigrants | Saudi Arabia | 97.5 /100 | #75 | Exceptional 2.7% |
| Asians | 97.5 /100 | #76 | Exceptional 2.7% |
| Immigrants | Malaysia | 97.5 /100 | #77 | Exceptional 2.7% |
| Mongolians | 97.4 /100 | #78 | Exceptional 2.7% |
Demographics Similar to Immigrants from Uganda by Hearing Disability
In terms of hearing disability, the demographic groups most similar to Immigrants from Uganda are Immigrants from Vietnam (2.9%, a difference of 0.020%), South American Indian (2.9%, a difference of 0.050%), Immigrants from Western Asia (2.9%, a difference of 0.050%), Immigrants from Kenya (2.9%, a difference of 0.10%), and Chilean (2.9%, a difference of 0.16%).
| Demographics | Rating | Rank | Hearing Disability |
| Liberians | 89.0 /100 | #122 | Excellent 2.8% |
| Immigrants | Zaire | 88.6 /100 | #123 | Excellent 2.9% |
| Bahamians | 88.6 /100 | #124 | Excellent 2.9% |
| Immigrants | Albania | 88.5 /100 | #125 | Excellent 2.9% |
| Immigrants | Sudan | 87.8 /100 | #126 | Excellent 2.9% |
| South American Indians | 86.9 /100 | #127 | Excellent 2.9% |
| Immigrants | Western Asia | 86.9 /100 | #128 | Excellent 2.9% |
| Immigrants | Uganda | 86.6 /100 | #129 | Excellent 2.9% |
| Immigrants | Vietnam | 86.5 /100 | #130 | Excellent 2.9% |
| Immigrants | Kenya | 86.1 /100 | #131 | Excellent 2.9% |
| Chileans | 85.8 /100 | #132 | Excellent 2.9% |
| Immigrants | Syria | 85.8 /100 | #133 | Excellent 2.9% |
| Ugandans | 85.5 /100 | #134 | Excellent 2.9% |
| Soviet Union | 84.8 /100 | #135 | Excellent 2.9% |
| Immigrants | Brazil | 84.6 /100 | #136 | Excellent 2.9% |