Cheyenne vs Immigrants from Uganda Hearing Disability
COMPARE
Cheyenne
Immigrants from Uganda
Hearing Disability
Hearing Disability Comparison
Cheyenne
Immigrants from Uganda
4.0%
HEARING DISABILITY
0.0/ 100
METRIC RATING
318th/ 347
METRIC RANK
2.9%
HEARING DISABILITY
86.6/ 100
METRIC RATING
129th/ 347
METRIC RANK
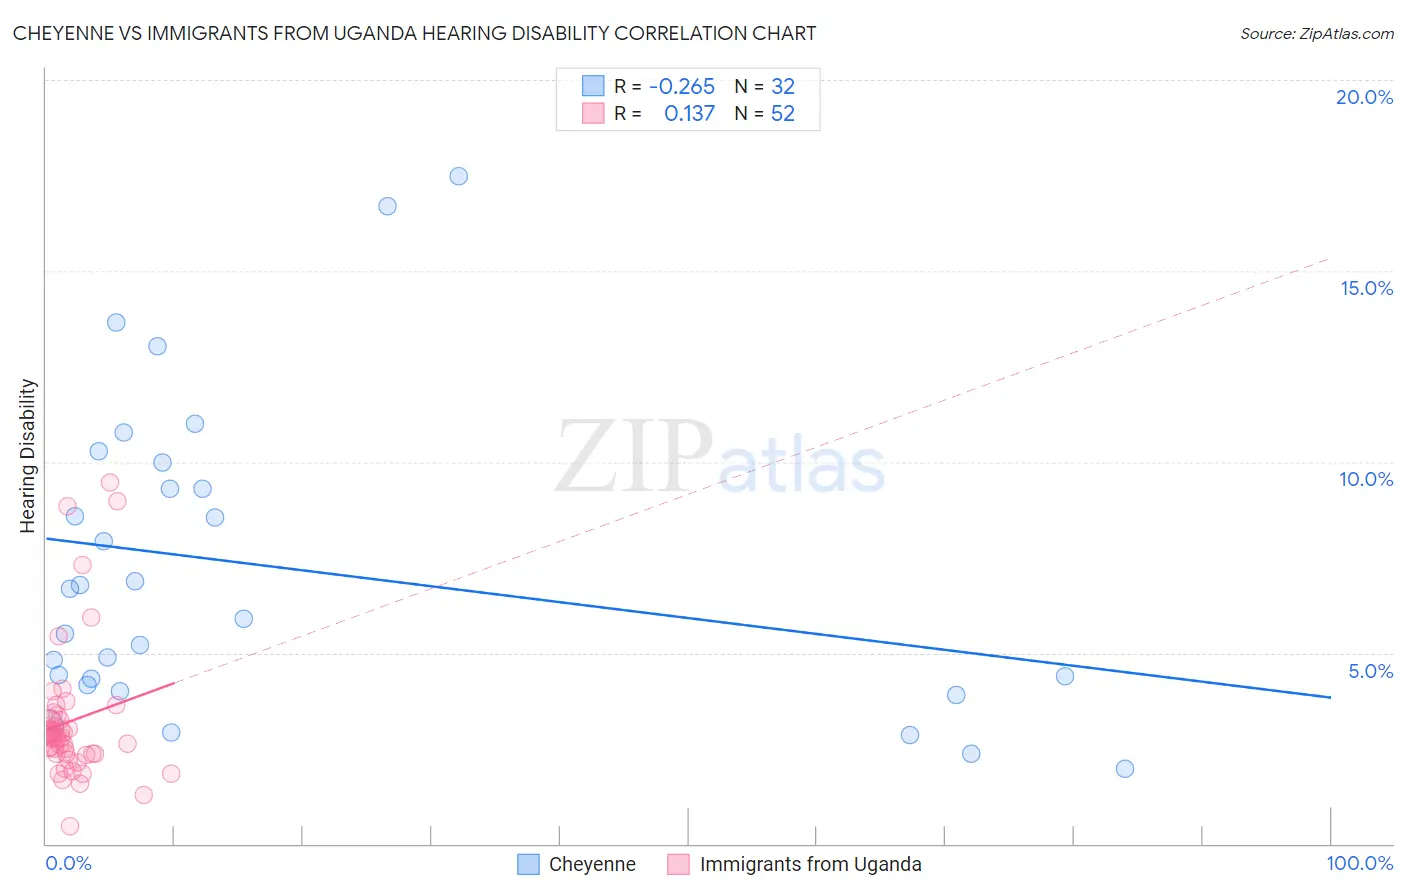
Cheyenne vs Immigrants from Uganda Hearing Disability Correlation Chart
The statistical analysis conducted on geographies consisting of 80,707,533 people shows a weak negative correlation between the proportion of Cheyenne and percentage of population with hearing disability in the United States with a correlation coefficient (R) of -0.265 and weighted average of 4.0%. Similarly, the statistical analysis conducted on geographies consisting of 125,979,149 people shows a poor positive correlation between the proportion of Immigrants from Uganda and percentage of population with hearing disability in the United States with a correlation coefficient (R) of 0.137 and weighted average of 2.9%, a difference of 38.6%.
Hearing Disability Correlation Summary
| Measurement | Cheyenne | Immigrants from Uganda |
| Minimum | 2.0% | 0.45% |
| Maximum | 17.5% | 9.4% |
| Range | 15.5% | 9.0% |
| Mean | 7.2% | 3.2% |
| Median | 6.3% | 2.8% |
| Interquartile 25% (IQ1) | 4.2% | 2.4% |
| Interquartile 75% (IQ3) | 9.6% | 3.3% |
| Interquartile Range (IQR) | 5.4% | 0.98% |
| Standard Deviation (Sample) | 4.0% | 1.8% |
| Standard Deviation (Population) | 4.0% | 1.8% |
Similar Demographics by Hearing Disability
Demographics Similar to Cheyenne by Hearing Disability
In terms of hearing disability, the demographic groups most similar to Cheyenne are Comanche (4.0%, a difference of 0.17%), Spanish American (4.0%, a difference of 0.31%), Puget Sound Salish (3.9%, a difference of 0.51%), Yakama (3.9%, a difference of 0.52%), and Chippewa (4.0%, a difference of 0.65%).
| Demographics | Rating | Rank | Hearing Disability |
| Americans | 0.0 /100 | #311 | Tragic 3.9% |
| Cajuns | 0.0 /100 | #312 | Tragic 3.9% |
| Hopi | 0.0 /100 | #313 | Tragic 3.9% |
| Yakama | 0.0 /100 | #314 | Tragic 3.9% |
| Puget Sound Salish | 0.0 /100 | #315 | Tragic 3.9% |
| Spanish Americans | 0.0 /100 | #316 | Tragic 4.0% |
| Comanche | 0.0 /100 | #317 | Tragic 4.0% |
| Cheyenne | 0.0 /100 | #318 | Tragic 4.0% |
| Chippewa | 0.0 /100 | #319 | Tragic 4.0% |
| Shoshone | 0.0 /100 | #320 | Tragic 4.0% |
| Paiute | 0.0 /100 | #321 | Tragic 4.1% |
| Seminole | 0.0 /100 | #322 | Tragic 4.1% |
| Apache | 0.0 /100 | #323 | Tragic 4.1% |
| Osage | 0.0 /100 | #324 | Tragic 4.1% |
| Lumbee | 0.0 /100 | #325 | Tragic 4.1% |
Demographics Similar to Immigrants from Uganda by Hearing Disability
In terms of hearing disability, the demographic groups most similar to Immigrants from Uganda are Immigrants from Vietnam (2.9%, a difference of 0.020%), South American Indian (2.9%, a difference of 0.050%), Immigrants from Western Asia (2.9%, a difference of 0.050%), Immigrants from Kenya (2.9%, a difference of 0.10%), and Chilean (2.9%, a difference of 0.16%).
| Demographics | Rating | Rank | Hearing Disability |
| Liberians | 89.0 /100 | #122 | Excellent 2.8% |
| Immigrants | Zaire | 88.6 /100 | #123 | Excellent 2.9% |
| Bahamians | 88.6 /100 | #124 | Excellent 2.9% |
| Immigrants | Albania | 88.5 /100 | #125 | Excellent 2.9% |
| Immigrants | Sudan | 87.8 /100 | #126 | Excellent 2.9% |
| South American Indians | 86.9 /100 | #127 | Excellent 2.9% |
| Immigrants | Western Asia | 86.9 /100 | #128 | Excellent 2.9% |
| Immigrants | Uganda | 86.6 /100 | #129 | Excellent 2.9% |
| Immigrants | Vietnam | 86.5 /100 | #130 | Excellent 2.9% |
| Immigrants | Kenya | 86.1 /100 | #131 | Excellent 2.9% |
| Chileans | 85.8 /100 | #132 | Excellent 2.9% |
| Immigrants | Syria | 85.8 /100 | #133 | Excellent 2.9% |
| Ugandans | 85.5 /100 | #134 | Excellent 2.9% |
| Soviet Union | 84.8 /100 | #135 | Excellent 2.9% |
| Immigrants | Brazil | 84.6 /100 | #136 | Excellent 2.9% |