Chickasaw vs Immigrants from Afghanistan Hearing Disability
COMPARE
Chickasaw
Immigrants from Afghanistan
Hearing Disability
Hearing Disability Comparison
Chickasaw
Immigrants from Afghanistan
4.5%
HEARING DISABILITY
0.0/ 100
METRIC RATING
337th/ 347
METRIC RANK
2.8%
HEARING DISABILITY
95.3/ 100
METRIC RATING
97th/ 347
METRIC RANK
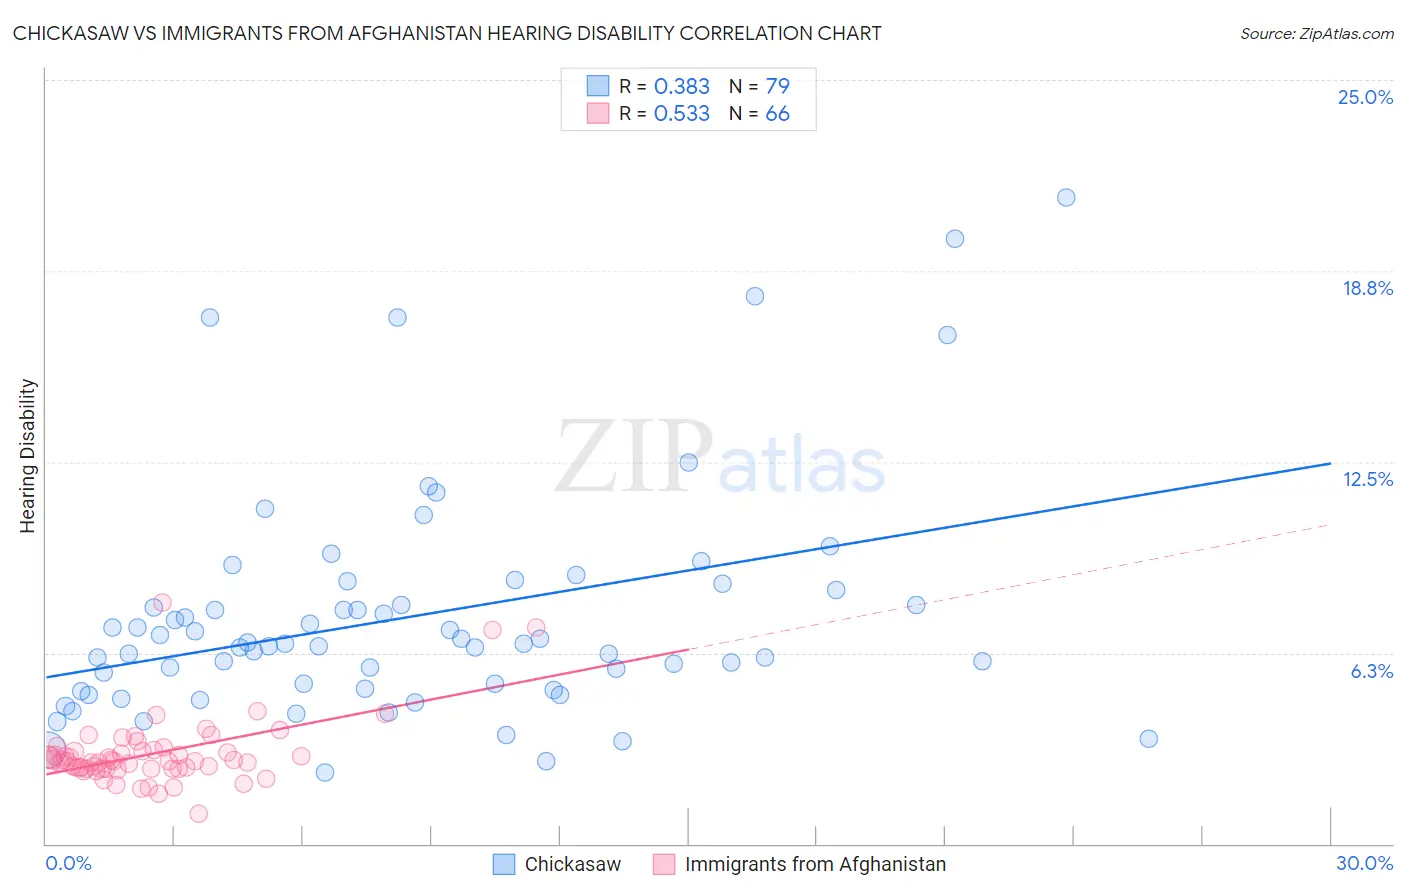
Chickasaw vs Immigrants from Afghanistan Hearing Disability Correlation Chart
The statistical analysis conducted on geographies consisting of 147,680,195 people shows a mild positive correlation between the proportion of Chickasaw and percentage of population with hearing disability in the United States with a correlation coefficient (R) of 0.383 and weighted average of 4.5%. Similarly, the statistical analysis conducted on geographies consisting of 147,605,800 people shows a substantial positive correlation between the proportion of Immigrants from Afghanistan and percentage of population with hearing disability in the United States with a correlation coefficient (R) of 0.533 and weighted average of 2.8%, a difference of 60.8%.
Hearing Disability Correlation Summary
| Measurement | Chickasaw | Immigrants from Afghanistan |
| Minimum | 2.3% | 0.97% |
| Maximum | 21.2% | 7.9% |
| Range | 18.8% | 6.9% |
| Mean | 7.4% | 2.9% |
| Median | 6.5% | 2.7% |
| Interquartile 25% (IQ1) | 5.1% | 2.5% |
| Interquartile 75% (IQ3) | 8.3% | 3.0% |
| Interquartile Range (IQR) | 3.2% | 0.57% |
| Standard Deviation (Sample) | 3.8% | 1.1% |
| Standard Deviation (Population) | 3.8% | 1.1% |
Similar Demographics by Hearing Disability
Demographics Similar to Chickasaw by Hearing Disability
In terms of hearing disability, the demographic groups most similar to Chickasaw are Alaska Native (4.5%, a difference of 0.21%), Choctaw (4.5%, a difference of 1.6%), Creek (4.4%, a difference of 2.5%), Pueblo (4.6%, a difference of 3.2%), and Kiowa (4.3%, a difference of 3.2%).
| Demographics | Rating | Rank | Hearing Disability |
| Natives/Alaskans | 0.0 /100 | #330 | Tragic 4.2% |
| Cherokee | 0.0 /100 | #331 | Tragic 4.2% |
| Houma | 0.0 /100 | #332 | Tragic 4.2% |
| Dutch West Indians | 0.0 /100 | #333 | Tragic 4.3% |
| Aleuts | 0.0 /100 | #334 | Tragic 4.3% |
| Kiowa | 0.0 /100 | #335 | Tragic 4.3% |
| Creek | 0.0 /100 | #336 | Tragic 4.4% |
| Chickasaw | 0.0 /100 | #337 | Tragic 4.5% |
| Alaska Natives | 0.0 /100 | #338 | Tragic 4.5% |
| Choctaw | 0.0 /100 | #339 | Tragic 4.5% |
| Pueblo | 0.0 /100 | #340 | Tragic 4.6% |
| Navajo | 0.0 /100 | #341 | Tragic 4.6% |
| Tsimshian | 0.0 /100 | #342 | Tragic 4.7% |
| Inupiat | 0.0 /100 | #343 | Tragic 4.7% |
| Tlingit-Haida | 0.0 /100 | #344 | Tragic 4.8% |
Demographics Similar to Immigrants from Afghanistan by Hearing Disability
In terms of hearing disability, the demographic groups most similar to Immigrants from Afghanistan are Immigrants from Honduras (2.8%, a difference of 0.060%), Immigrants from Guatemala (2.8%, a difference of 0.10%), Immigrants from Eastern Africa (2.8%, a difference of 0.15%), Immigrants from Somalia (2.8%, a difference of 0.17%), and Immigrants from Spain (2.8%, a difference of 0.21%).
| Demographics | Rating | Rank | Hearing Disability |
| Immigrants | Morocco | 96.6 /100 | #90 | Exceptional 2.8% |
| Immigrants | Middle Africa | 96.5 /100 | #91 | Exceptional 2.8% |
| Iranians | 96.4 /100 | #92 | Exceptional 2.8% |
| Immigrants | Kuwait | 96.3 /100 | #93 | Exceptional 2.8% |
| Uruguayans | 95.9 /100 | #94 | Exceptional 2.8% |
| Israelis | 95.9 /100 | #95 | Exceptional 2.8% |
| Immigrants | Somalia | 95.5 /100 | #96 | Exceptional 2.8% |
| Immigrants | Afghanistan | 95.3 /100 | #97 | Exceptional 2.8% |
| Immigrants | Honduras | 95.1 /100 | #98 | Exceptional 2.8% |
| Immigrants | Guatemala | 95.1 /100 | #99 | Exceptional 2.8% |
| Immigrants | Eastern Africa | 95.0 /100 | #100 | Exceptional 2.8% |
| Immigrants | Spain | 94.9 /100 | #101 | Exceptional 2.8% |
| Taiwanese | 94.8 /100 | #102 | Exceptional 2.8% |
| Immigrants | Indonesia | 94.7 /100 | #103 | Exceptional 2.8% |
| Burmese | 94.2 /100 | #104 | Exceptional 2.8% |