Guyanese vs Immigrants from Uganda Hearing Disability
COMPARE
Guyanese
Immigrants from Uganda
Hearing Disability
Hearing Disability Comparison
Guyanese
Immigrants from Uganda
2.3%
HEARING DISABILITY
100.0/ 100
METRIC RATING
3rd/ 347
METRIC RANK
2.9%
HEARING DISABILITY
86.6/ 100
METRIC RATING
129th/ 347
METRIC RANK
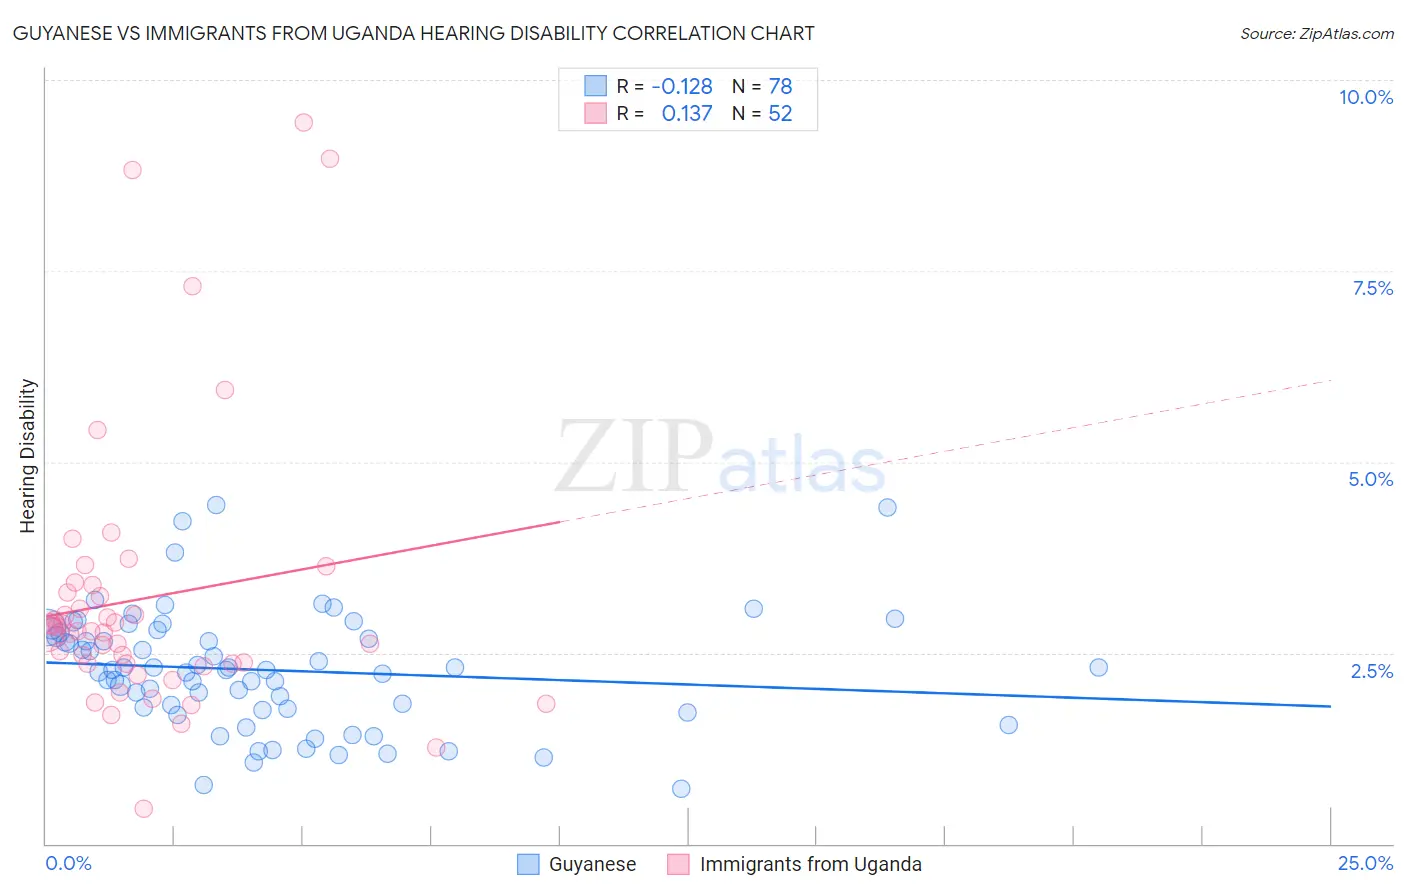
Guyanese vs Immigrants from Uganda Hearing Disability Correlation Chart
The statistical analysis conducted on geographies consisting of 176,815,788 people shows a poor negative correlation between the proportion of Guyanese and percentage of population with hearing disability in the United States with a correlation coefficient (R) of -0.128 and weighted average of 2.3%. Similarly, the statistical analysis conducted on geographies consisting of 125,979,149 people shows a poor positive correlation between the proportion of Immigrants from Uganda and percentage of population with hearing disability in the United States with a correlation coefficient (R) of 0.137 and weighted average of 2.9%, a difference of 25.3%.
Hearing Disability Correlation Summary
| Measurement | Guyanese | Immigrants from Uganda |
| Minimum | 0.72% | 0.45% |
| Maximum | 4.4% | 9.4% |
| Range | 3.7% | 9.0% |
| Mean | 2.3% | 3.2% |
| Median | 2.3% | 2.8% |
| Interquartile 25% (IQ1) | 1.8% | 2.4% |
| Interquartile 75% (IQ3) | 2.8% | 3.3% |
| Interquartile Range (IQR) | 0.99% | 0.98% |
| Standard Deviation (Sample) | 0.77% | 1.8% |
| Standard Deviation (Population) | 0.76% | 1.8% |
Similar Demographics by Hearing Disability
Demographics Similar to Guyanese by Hearing Disability
In terms of hearing disability, the demographic groups most similar to Guyanese are Immigrants from St. Vincent and the Grenadines (2.3%, a difference of 1.4%), Immigrants from Guyana (2.3%, a difference of 1.4%), Immigrants from Barbados (2.4%, a difference of 3.3%), Immigrants from Grenada (2.2%, a difference of 4.3%), and Vietnamese (2.4%, a difference of 4.5%).
| Demographics | Rating | Rank | Hearing Disability |
| Immigrants | Grenada | 100.0 /100 | #1 | Exceptional 2.2% |
| Immigrants | St. Vincent and the Grenadines | 100.0 /100 | #2 | Exceptional 2.3% |
| Guyanese | 100.0 /100 | #3 | Exceptional 2.3% |
| Immigrants | Guyana | 100.0 /100 | #4 | Exceptional 2.3% |
| Immigrants | Barbados | 100.0 /100 | #5 | Exceptional 2.4% |
| Vietnamese | 100.0 /100 | #6 | Exceptional 2.4% |
| Immigrants | Bangladesh | 100.0 /100 | #7 | Exceptional 2.4% |
| British West Indians | 100.0 /100 | #8 | Exceptional 2.4% |
| Immigrants | Dominican Republic | 100.0 /100 | #9 | Exceptional 2.4% |
| Immigrants | Ecuador | 99.9 /100 | #10 | Exceptional 2.5% |
| Immigrants | Trinidad and Tobago | 99.9 /100 | #11 | Exceptional 2.5% |
| Trinidadians and Tobagonians | 99.9 /100 | #12 | Exceptional 2.5% |
| Sierra Leoneans | 99.9 /100 | #13 | Exceptional 2.5% |
| Ecuadorians | 99.9 /100 | #14 | Exceptional 2.5% |
| Barbadians | 99.9 /100 | #15 | Exceptional 2.5% |
Demographics Similar to Immigrants from Uganda by Hearing Disability
In terms of hearing disability, the demographic groups most similar to Immigrants from Uganda are Immigrants from Vietnam (2.9%, a difference of 0.020%), South American Indian (2.9%, a difference of 0.050%), Immigrants from Western Asia (2.9%, a difference of 0.050%), Immigrants from Kenya (2.9%, a difference of 0.10%), and Chilean (2.9%, a difference of 0.16%).
| Demographics | Rating | Rank | Hearing Disability |
| Liberians | 89.0 /100 | #122 | Excellent 2.8% |
| Immigrants | Zaire | 88.6 /100 | #123 | Excellent 2.9% |
| Bahamians | 88.6 /100 | #124 | Excellent 2.9% |
| Immigrants | Albania | 88.5 /100 | #125 | Excellent 2.9% |
| Immigrants | Sudan | 87.8 /100 | #126 | Excellent 2.9% |
| South American Indians | 86.9 /100 | #127 | Excellent 2.9% |
| Immigrants | Western Asia | 86.9 /100 | #128 | Excellent 2.9% |
| Immigrants | Uganda | 86.6 /100 | #129 | Excellent 2.9% |
| Immigrants | Vietnam | 86.5 /100 | #130 | Excellent 2.9% |
| Immigrants | Kenya | 86.1 /100 | #131 | Excellent 2.9% |
| Chileans | 85.8 /100 | #132 | Excellent 2.9% |
| Immigrants | Syria | 85.8 /100 | #133 | Excellent 2.9% |
| Ugandans | 85.5 /100 | #134 | Excellent 2.9% |
| Soviet Union | 84.8 /100 | #135 | Excellent 2.9% |
| Immigrants | Brazil | 84.6 /100 | #136 | Excellent 2.9% |