Chickasaw vs Crow Hearing Disability
COMPARE
Chickasaw
Crow
Hearing Disability
Hearing Disability Comparison
Chickasaw
Crow
4.5%
HEARING DISABILITY
0.0/ 100
METRIC RATING
337th/ 347
METRIC RANK
4.2%
HEARING DISABILITY
0.0/ 100
METRIC RATING
329th/ 347
METRIC RANK
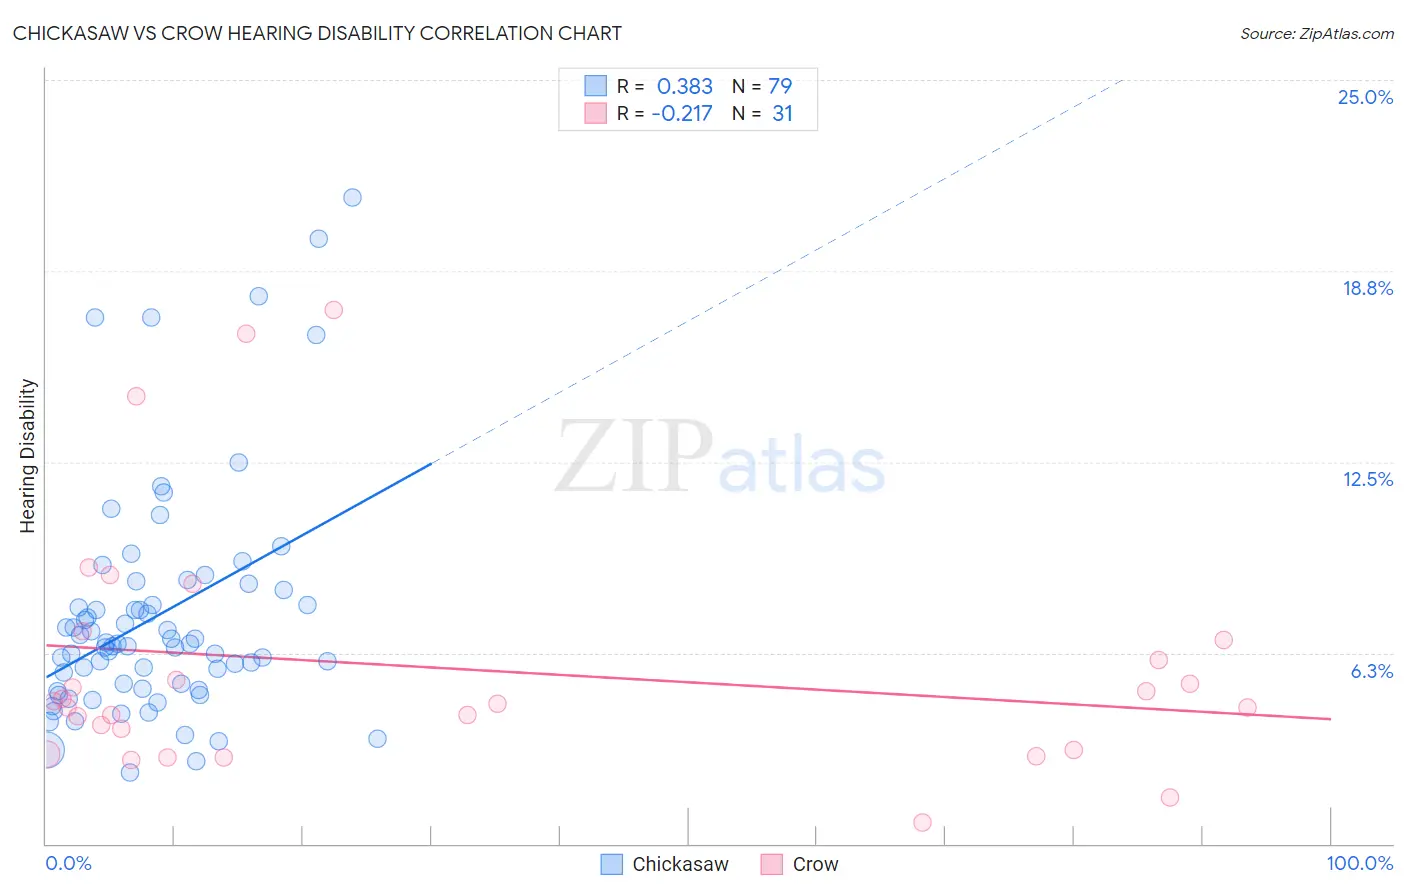
Chickasaw vs Crow Hearing Disability Correlation Chart
The statistical analysis conducted on geographies consisting of 147,680,195 people shows a mild positive correlation between the proportion of Chickasaw and percentage of population with hearing disability in the United States with a correlation coefficient (R) of 0.383 and weighted average of 4.5%. Similarly, the statistical analysis conducted on geographies consisting of 59,194,968 people shows a weak negative correlation between the proportion of Crow and percentage of population with hearing disability in the United States with a correlation coefficient (R) of -0.217 and weighted average of 4.2%, a difference of 7.5%.
Hearing Disability Correlation Summary
| Measurement | Chickasaw | Crow |
| Minimum | 2.3% | 0.69% |
| Maximum | 21.2% | 17.5% |
| Range | 18.8% | 16.8% |
| Mean | 7.4% | 5.7% |
| Median | 6.5% | 4.6% |
| Interquartile 25% (IQ1) | 5.1% | 3.1% |
| Interquartile 75% (IQ3) | 8.3% | 6.7% |
| Interquartile Range (IQR) | 3.2% | 3.6% |
| Standard Deviation (Sample) | 3.8% | 4.0% |
| Standard Deviation (Population) | 3.8% | 3.9% |
Demographics Similar to Chickasaw and Crow by Hearing Disability
In terms of hearing disability, the demographic groups most similar to Chickasaw are Alaska Native (4.5%, a difference of 0.21%), Choctaw (4.5%, a difference of 1.6%), Creek (4.4%, a difference of 2.5%), Pueblo (4.6%, a difference of 3.2%), and Kiowa (4.3%, a difference of 3.2%). Similarly, the demographic groups most similar to Crow are Tohono O'odham (4.2%, a difference of 0.010%), Arapaho (4.1%, a difference of 0.39%), Native/Alaskan (4.2%, a difference of 0.79%), Cherokee (4.2%, a difference of 0.94%), and Potawatomi (4.1%, a difference of 1.1%).
| Demographics | Rating | Rank | Hearing Disability |
| Apache | 0.0 /100 | #323 | Tragic 4.1% |
| Osage | 0.0 /100 | #324 | Tragic 4.1% |
| Lumbee | 0.0 /100 | #325 | Tragic 4.1% |
| Potawatomi | 0.0 /100 | #326 | Tragic 4.1% |
| Arapaho | 0.0 /100 | #327 | Tragic 4.1% |
| Tohono O'odham | 0.0 /100 | #328 | Tragic 4.2% |
| Crow | 0.0 /100 | #329 | Tragic 4.2% |
| Natives/Alaskans | 0.0 /100 | #330 | Tragic 4.2% |
| Cherokee | 0.0 /100 | #331 | Tragic 4.2% |
| Houma | 0.0 /100 | #332 | Tragic 4.2% |
| Dutch West Indians | 0.0 /100 | #333 | Tragic 4.3% |
| Aleuts | 0.0 /100 | #334 | Tragic 4.3% |
| Kiowa | 0.0 /100 | #335 | Tragic 4.3% |
| Creek | 0.0 /100 | #336 | Tragic 4.4% |
| Chickasaw | 0.0 /100 | #337 | Tragic 4.5% |
| Alaska Natives | 0.0 /100 | #338 | Tragic 4.5% |
| Choctaw | 0.0 /100 | #339 | Tragic 4.5% |
| Pueblo | 0.0 /100 | #340 | Tragic 4.6% |
| Navajo | 0.0 /100 | #341 | Tragic 4.6% |
| Tsimshian | 0.0 /100 | #342 | Tragic 4.7% |
| Inupiat | 0.0 /100 | #343 | Tragic 4.7% |