Chickasaw vs Immigrants from Fiji Male Disability
COMPARE
Chickasaw
Immigrants from Fiji
Male Disability
Male Disability Comparison
Chickasaw
Immigrants from Fiji
15.1%
MALE DISABILITY
0.0/ 100
METRIC RATING
339th/ 347
METRIC RANK
11.0%
MALE DISABILITY
84.0/ 100
METRIC RATING
132nd/ 347
METRIC RANK
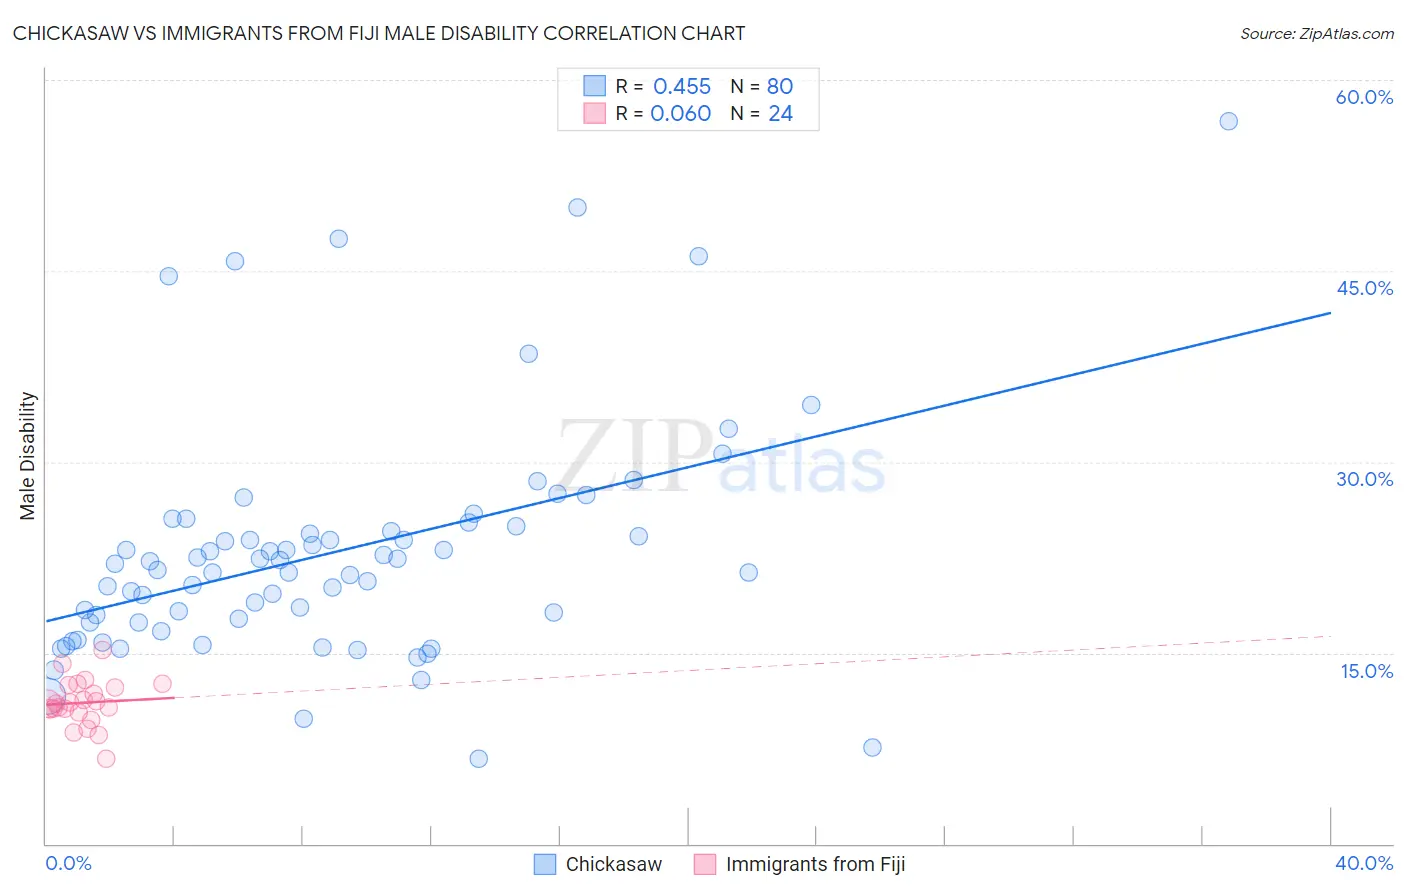
Chickasaw vs Immigrants from Fiji Male Disability Correlation Chart
The statistical analysis conducted on geographies consisting of 147,685,248 people shows a moderate positive correlation between the proportion of Chickasaw and percentage of males with a disability in the United States with a correlation coefficient (R) of 0.455 and weighted average of 15.1%. Similarly, the statistical analysis conducted on geographies consisting of 93,755,192 people shows a slight positive correlation between the proportion of Immigrants from Fiji and percentage of males with a disability in the United States with a correlation coefficient (R) of 0.060 and weighted average of 11.0%, a difference of 38.0%.
Male Disability Correlation Summary
| Measurement | Chickasaw | Immigrants from Fiji |
| Minimum | 6.7% | 6.7% |
| Maximum | 56.8% | 15.2% |
| Range | 50.1% | 8.5% |
| Mean | 22.9% | 11.1% |
| Median | 21.7% | 11.0% |
| Interquartile 25% (IQ1) | 17.4% | 10.4% |
| Interquartile 75% (IQ3) | 24.7% | 12.4% |
| Interquartile Range (IQR) | 7.4% | 1.9% |
| Standard Deviation (Sample) | 9.2% | 1.8% |
| Standard Deviation (Population) | 9.1% | 1.8% |
Similar Demographics by Male Disability
Demographics Similar to Chickasaw by Male Disability
In terms of male disability, the demographic groups most similar to Chickasaw are Lumbee (15.2%, a difference of 0.74%), Pueblo (15.0%, a difference of 0.80%), Menominee (15.0%, a difference of 0.91%), Alaskan Athabascan (14.9%, a difference of 1.4%), and Choctaw (15.4%, a difference of 1.8%).
| Demographics | Rating | Rank | Male Disability |
| Seminole | 0.0 /100 | #332 | Tragic 14.7% |
| Yuman | 0.0 /100 | #333 | Tragic 14.7% |
| Cherokee | 0.0 /100 | #334 | Tragic 14.8% |
| Dutch West Indians | 0.0 /100 | #335 | Tragic 14.8% |
| Alaskan Athabascans | 0.0 /100 | #336 | Tragic 14.9% |
| Menominee | 0.0 /100 | #337 | Tragic 15.0% |
| Pueblo | 0.0 /100 | #338 | Tragic 15.0% |
| Chickasaw | 0.0 /100 | #339 | Tragic 15.1% |
| Lumbee | 0.0 /100 | #340 | Tragic 15.2% |
| Choctaw | 0.0 /100 | #341 | Tragic 15.4% |
| Kiowa | 0.0 /100 | #342 | Tragic 15.4% |
| Creek | 0.0 /100 | #343 | Tragic 15.5% |
| Puerto Ricans | 0.0 /100 | #344 | Tragic 15.6% |
| Tsimshian | 0.0 /100 | #345 | Tragic 15.6% |
| Colville | 0.0 /100 | #346 | Tragic 16.5% |
Demographics Similar to Immigrants from Fiji by Male Disability
In terms of male disability, the demographic groups most similar to Immigrants from Fiji are Ugandan (11.0%, a difference of 0.010%), Macedonian (11.0%, a difference of 0.020%), Bhutanese (11.0%, a difference of 0.070%), Trinidadian and Tobagonian (11.0%, a difference of 0.080%), and Immigrants from Costa Rica (11.0%, a difference of 0.13%).
| Demographics | Rating | Rank | Male Disability |
| Immigrants | North Macedonia | 88.1 /100 | #125 | Excellent 10.9% |
| Immigrants | Trinidad and Tobago | 86.9 /100 | #126 | Excellent 10.9% |
| Immigrants | Ukraine | 86.8 /100 | #127 | Excellent 10.9% |
| Immigrants | Latvia | 85.5 /100 | #128 | Excellent 10.9% |
| Immigrants | Philippines | 85.4 /100 | #129 | Excellent 10.9% |
| Brazilians | 85.4 /100 | #130 | Excellent 10.9% |
| Macedonians | 84.2 /100 | #131 | Excellent 11.0% |
| Immigrants | Fiji | 84.0 /100 | #132 | Excellent 11.0% |
| Ugandans | 83.9 /100 | #133 | Excellent 11.0% |
| Bhutanese | 83.4 /100 | #134 | Excellent 11.0% |
| Trinidadians and Tobagonians | 83.3 /100 | #135 | Excellent 11.0% |
| Immigrants | Costa Rica | 82.8 /100 | #136 | Excellent 11.0% |
| Immigrants | Europe | 82.0 /100 | #137 | Excellent 11.0% |
| Nigerians | 81.9 /100 | #138 | Excellent 11.0% |
| South Africans | 81.7 /100 | #139 | Excellent 11.0% |