Chickasaw vs Immigrants from Fiji Single Father Households
COMPARE
Chickasaw
Immigrants from Fiji
Single Father Households
Single Father Households Comparison
Chickasaw
Immigrants from Fiji
2.8%
SINGLE FATHER HOUSEHOLDS
0.0/ 100
METRIC RATING
295th/ 347
METRIC RANK
2.7%
SINGLE FATHER HOUSEHOLDS
0.0/ 100
METRIC RATING
293rd/ 347
METRIC RANK
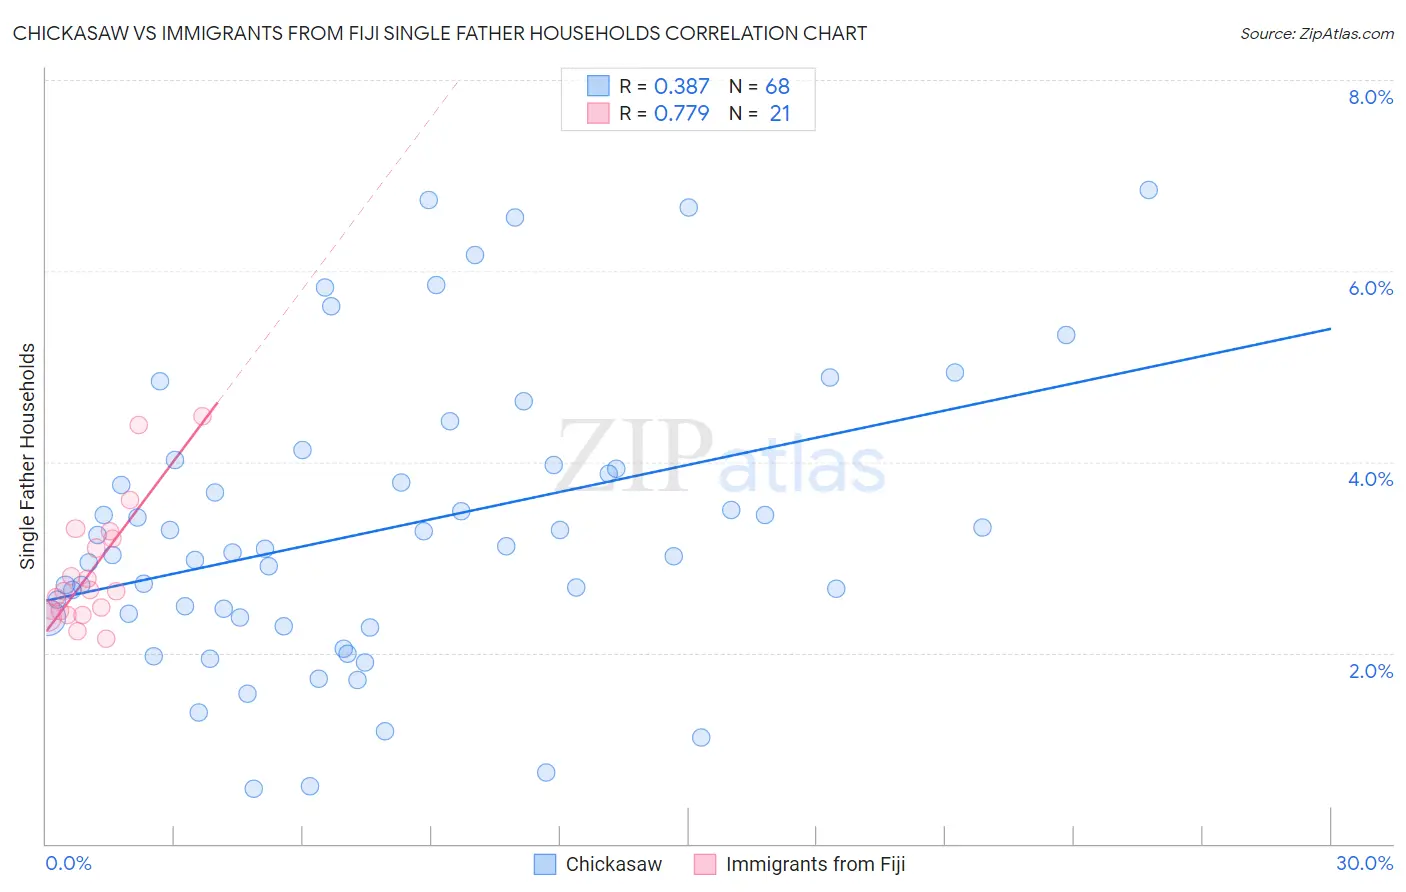
Chickasaw vs Immigrants from Fiji Single Father Households Correlation Chart
The statistical analysis conducted on geographies consisting of 147,211,099 people shows a mild positive correlation between the proportion of Chickasaw and percentage of single father households in the United States with a correlation coefficient (R) of 0.387 and weighted average of 2.8%. Similarly, the statistical analysis conducted on geographies consisting of 93,616,841 people shows a strong positive correlation between the proportion of Immigrants from Fiji and percentage of single father households in the United States with a correlation coefficient (R) of 0.779 and weighted average of 2.7%, a difference of 1.2%.
Single Father Households Correlation Summary
| Measurement | Chickasaw | Immigrants from Fiji |
| Minimum | 0.57% | 2.1% |
| Maximum | 6.8% | 4.5% |
| Range | 6.3% | 2.3% |
| Mean | 3.3% | 2.9% |
| Median | 3.1% | 2.6% |
| Interquartile 25% (IQ1) | 2.4% | 2.4% |
| Interquartile 75% (IQ3) | 3.9% | 3.2% |
| Interquartile Range (IQR) | 1.6% | 0.81% |
| Standard Deviation (Sample) | 1.5% | 0.64% |
| Standard Deviation (Population) | 1.5% | 0.63% |
Demographics Similar to Chickasaw and Immigrants from Fiji by Single Father Households
In terms of single father households, the demographic groups most similar to Chickasaw are Japanese (2.8%, a difference of 0.020%), Honduran (2.8%, a difference of 0.10%), Cree (2.8%, a difference of 0.59%), Malaysian (2.7%, a difference of 0.80%), and Lumbee (2.8%, a difference of 0.97%). Similarly, the demographic groups most similar to Immigrants from Fiji are Choctaw (2.7%, a difference of 0.16%), Malaysian (2.7%, a difference of 0.43%), Blackfeet (2.7%, a difference of 0.62%), Puget Sound Salish (2.7%, a difference of 1.2%), and Japanese (2.8%, a difference of 1.3%).
| Demographics | Rating | Rank | Single Father Households |
| Hawaiians | 0.1 /100 | #284 | Tragic 2.7% |
| Ottawa | 0.1 /100 | #285 | Tragic 2.7% |
| Immigrants | Cuba | 0.1 /100 | #286 | Tragic 2.7% |
| Central American Indians | 0.0 /100 | #287 | Tragic 2.7% |
| Immigrants | Cambodia | 0.0 /100 | #288 | Tragic 2.7% |
| Tlingit-Haida | 0.0 /100 | #289 | Tragic 2.7% |
| Puget Sound Salish | 0.0 /100 | #290 | Tragic 2.7% |
| Blackfeet | 0.0 /100 | #291 | Tragic 2.7% |
| Choctaw | 0.0 /100 | #292 | Tragic 2.7% |
| Immigrants | Fiji | 0.0 /100 | #293 | Tragic 2.7% |
| Malaysians | 0.0 /100 | #294 | Tragic 2.7% |
| Chickasaw | 0.0 /100 | #295 | Tragic 2.8% |
| Japanese | 0.0 /100 | #296 | Tragic 2.8% |
| Hondurans | 0.0 /100 | #297 | Tragic 2.8% |
| Cree | 0.0 /100 | #298 | Tragic 2.8% |
| Lumbee | 0.0 /100 | #299 | Tragic 2.8% |
| Kiowa | 0.0 /100 | #300 | Tragic 2.8% |
| Immigrants | Latin America | 0.0 /100 | #301 | Tragic 2.8% |
| Spanish Americans | 0.0 /100 | #302 | Tragic 2.8% |
| Immigrants | Honduras | 0.0 /100 | #303 | Tragic 2.8% |
| Mexican American Indians | 0.0 /100 | #304 | Tragic 2.8% |