Chickasaw vs Immigrants from Fiji Child Poverty Under the Age of 16
COMPARE
Chickasaw
Immigrants from Fiji
Child Poverty Under the Age of 16
Child Poverty Under the Age of 16 Comparison
Chickasaw
Immigrants from Fiji
19.5%
CHILD POVERTY UNDER THE AGE OF 16
0.1/ 100
METRIC RATING
265th/ 347
METRIC RANK
15.8%
CHILD POVERTY UNDER THE AGE OF 16
71.1/ 100
METRIC RATING
159th/ 347
METRIC RANK
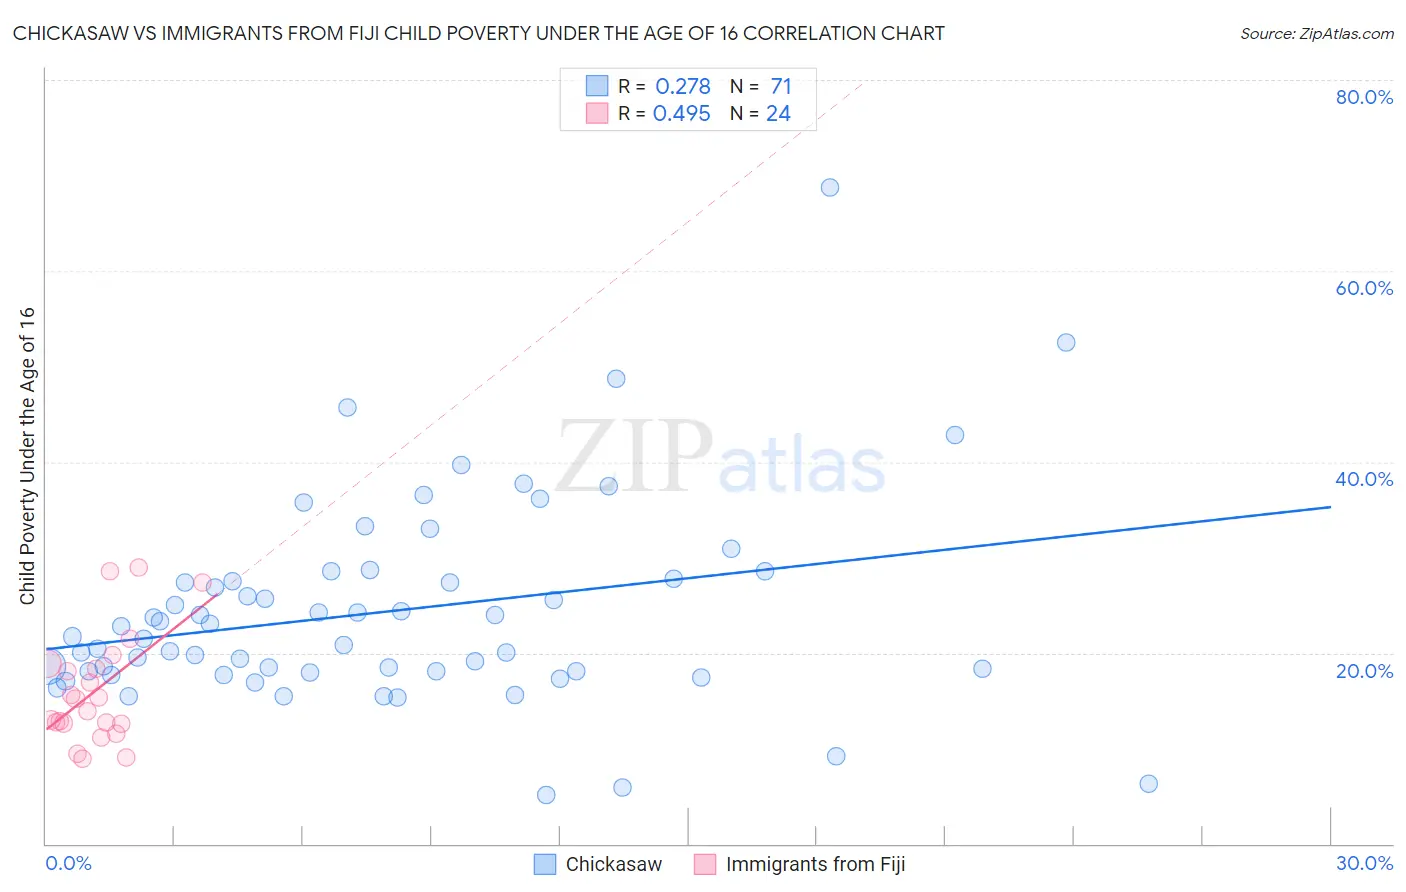
Chickasaw vs Immigrants from Fiji Child Poverty Under the Age of 16 Correlation Chart
The statistical analysis conducted on geographies consisting of 147,366,373 people shows a weak positive correlation between the proportion of Chickasaw and poverty level among children under the age of 16 in the United States with a correlation coefficient (R) of 0.278 and weighted average of 19.5%. Similarly, the statistical analysis conducted on geographies consisting of 93,637,524 people shows a moderate positive correlation between the proportion of Immigrants from Fiji and poverty level among children under the age of 16 in the United States with a correlation coefficient (R) of 0.495 and weighted average of 15.8%, a difference of 23.5%.
Child Poverty Under the Age of 16 Correlation Summary
| Measurement | Chickasaw | Immigrants from Fiji |
| Minimum | 5.1% | 8.9% |
| Maximum | 68.8% | 28.9% |
| Range | 63.7% | 20.0% |
| Mean | 24.3% | 16.0% |
| Median | 21.7% | 14.5% |
| Interquartile 25% (IQ1) | 18.0% | 12.6% |
| Interquartile 75% (IQ3) | 27.8% | 18.6% |
| Interquartile Range (IQR) | 9.8% | 6.0% |
| Standard Deviation (Sample) | 10.7% | 5.8% |
| Standard Deviation (Population) | 10.6% | 5.7% |
Similar Demographics by Child Poverty Under the Age of 16
Demographics Similar to Chickasaw by Child Poverty Under the Age of 16
In terms of child poverty under the age of 16, the demographic groups most similar to Chickasaw are Liberian (19.5%, a difference of 0.10%), Immigrants from Ecuador (19.4%, a difference of 0.12%), Vietnamese (19.4%, a difference of 0.18%), Cherokee (19.5%, a difference of 0.40%), and Immigrants from Guyana (19.4%, a difference of 0.49%).
| Demographics | Rating | Rank | Child Poverty Under the Age of 16 |
| Spanish Americans | 0.2 /100 | #258 | Tragic 19.2% |
| Mexican American Indians | 0.2 /100 | #259 | Tragic 19.3% |
| Guyanese | 0.2 /100 | #260 | Tragic 19.3% |
| Immigrants | Burma/Myanmar | 0.1 /100 | #261 | Tragic 19.4% |
| Immigrants | Guyana | 0.1 /100 | #262 | Tragic 19.4% |
| Vietnamese | 0.1 /100 | #263 | Tragic 19.4% |
| Immigrants | Ecuador | 0.1 /100 | #264 | Tragic 19.4% |
| Chickasaw | 0.1 /100 | #265 | Tragic 19.5% |
| Liberians | 0.1 /100 | #266 | Tragic 19.5% |
| Cherokee | 0.1 /100 | #267 | Tragic 19.5% |
| Jamaicans | 0.1 /100 | #268 | Tragic 19.7% |
| Immigrants | El Salvador | 0.1 /100 | #269 | Tragic 19.7% |
| Spanish American Indians | 0.1 /100 | #270 | Tragic 19.7% |
| Immigrants | Liberia | 0.1 /100 | #271 | Tragic 19.7% |
| Immigrants | Bangladesh | 0.1 /100 | #272 | Tragic 19.8% |
Demographics Similar to Immigrants from Fiji by Child Poverty Under the Age of 16
In terms of child poverty under the age of 16, the demographic groups most similar to Immigrants from Fiji are Immigrants from Albania (15.8%, a difference of 0.070%), Immigrants from Chile (15.7%, a difference of 0.26%), Immigrants from Nepal (15.7%, a difference of 0.27%), Immigrants from Northern Africa (15.8%, a difference of 0.45%), and Colombian (15.8%, a difference of 0.51%).
| Demographics | Rating | Rank | Child Poverty Under the Age of 16 |
| French Canadians | 78.2 /100 | #152 | Good 15.6% |
| Venezuelans | 77.4 /100 | #153 | Good 15.6% |
| Samoans | 77.3 /100 | #154 | Good 15.6% |
| Syrians | 76.1 /100 | #155 | Good 15.6% |
| Immigrants | Venezuela | 74.9 /100 | #156 | Good 15.7% |
| Immigrants | Nepal | 72.9 /100 | #157 | Good 15.7% |
| Immigrants | Chile | 72.8 /100 | #158 | Good 15.7% |
| Immigrants | Fiji | 71.1 /100 | #159 | Good 15.8% |
| Immigrants | Albania | 70.7 /100 | #160 | Good 15.8% |
| Immigrants | Northern Africa | 68.1 /100 | #161 | Good 15.8% |
| Colombians | 67.6 /100 | #162 | Good 15.8% |
| Yugoslavians | 67.6 /100 | #163 | Good 15.8% |
| Immigrants | Germany | 67.3 /100 | #164 | Good 15.8% |
| Guamanians/Chamorros | 66.4 /100 | #165 | Good 15.9% |
| Immigrants | Oceania | 65.4 /100 | #166 | Good 15.9% |