Croatian vs Immigrants from Fiji Male Disability
COMPARE
Croatian
Immigrants from Fiji
Male Disability
Male Disability Comparison
Croatians
Immigrants from Fiji
11.8%
MALE DISABILITY
2.1/ 100
METRIC RATING
230th/ 347
METRIC RANK
11.0%
MALE DISABILITY
84.0/ 100
METRIC RATING
132nd/ 347
METRIC RANK
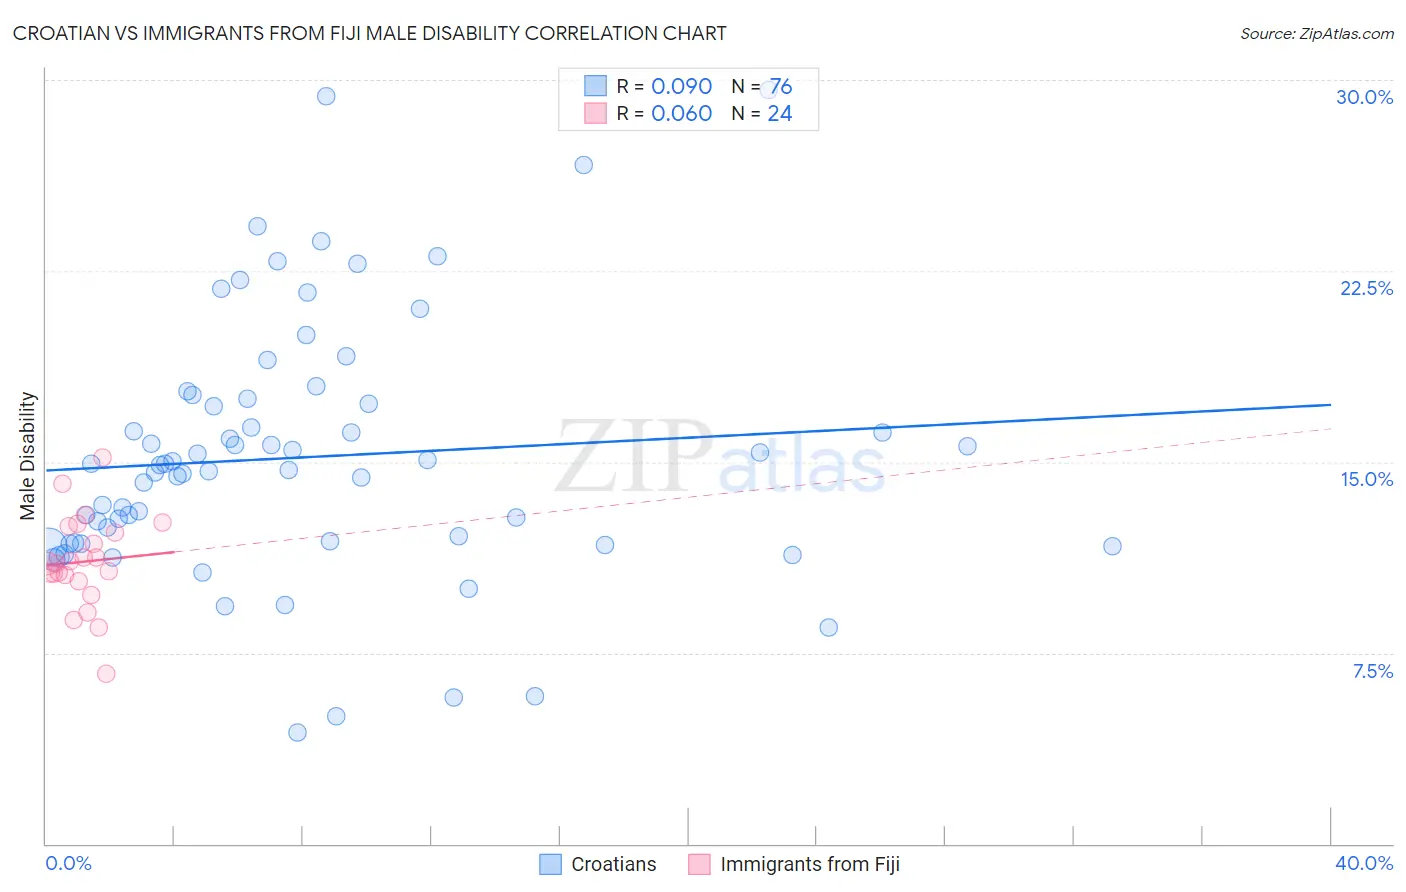
Croatian vs Immigrants from Fiji Male Disability Correlation Chart
The statistical analysis conducted on geographies consisting of 375,704,968 people shows a slight positive correlation between the proportion of Croatians and percentage of males with a disability in the United States with a correlation coefficient (R) of 0.090 and weighted average of 11.8%. Similarly, the statistical analysis conducted on geographies consisting of 93,755,192 people shows a slight positive correlation between the proportion of Immigrants from Fiji and percentage of males with a disability in the United States with a correlation coefficient (R) of 0.060 and weighted average of 11.0%, a difference of 7.8%.
Male Disability Correlation Summary
| Measurement | Croatian | Immigrants from Fiji |
| Minimum | 4.4% | 6.7% |
| Maximum | 29.6% | 15.2% |
| Range | 25.2% | 8.5% |
| Mean | 15.2% | 11.1% |
| Median | 14.8% | 11.0% |
| Interquartile 25% (IQ1) | 11.8% | 10.4% |
| Interquartile 75% (IQ3) | 17.4% | 12.4% |
| Interquartile Range (IQR) | 5.6% | 1.9% |
| Standard Deviation (Sample) | 5.0% | 1.8% |
| Standard Deviation (Population) | 5.0% | 1.8% |
Similar Demographics by Male Disability
Demographics Similar to Croatians by Male Disability
In terms of male disability, the demographic groups most similar to Croatians are Bermudan (11.8%, a difference of 0.090%), Hispanic or Latino (11.8%, a difference of 0.12%), Austrian (11.8%, a difference of 0.20%), Dominican (11.8%, a difference of 0.20%), and Malaysian (11.8%, a difference of 0.26%).
| Demographics | Rating | Rank | Male Disability |
| Immigrants | Bahamas | 3.2 /100 | #223 | Tragic 11.7% |
| Japanese | 3.1 /100 | #224 | Tragic 11.7% |
| Liberians | 3.1 /100 | #225 | Tragic 11.8% |
| Sub-Saharan Africans | 2.8 /100 | #226 | Tragic 11.8% |
| Austrians | 2.5 /100 | #227 | Tragic 11.8% |
| Hispanics or Latinos | 2.3 /100 | #228 | Tragic 11.8% |
| Bermudans | 2.3 /100 | #229 | Tragic 11.8% |
| Croatians | 2.1 /100 | #230 | Tragic 11.8% |
| Dominicans | 1.8 /100 | #231 | Tragic 11.8% |
| Malaysians | 1.8 /100 | #232 | Tragic 11.8% |
| Mexicans | 1.7 /100 | #233 | Tragic 11.8% |
| Immigrants | Canada | 1.6 /100 | #234 | Tragic 11.9% |
| Immigrants | North America | 1.5 /100 | #235 | Tragic 11.9% |
| U.S. Virgin Islanders | 1.3 /100 | #236 | Tragic 11.9% |
| Carpatho Rusyns | 1.3 /100 | #237 | Tragic 11.9% |
Demographics Similar to Immigrants from Fiji by Male Disability
In terms of male disability, the demographic groups most similar to Immigrants from Fiji are Ugandan (11.0%, a difference of 0.010%), Macedonian (11.0%, a difference of 0.020%), Bhutanese (11.0%, a difference of 0.070%), Trinidadian and Tobagonian (11.0%, a difference of 0.080%), and Immigrants from Costa Rica (11.0%, a difference of 0.13%).
| Demographics | Rating | Rank | Male Disability |
| Immigrants | North Macedonia | 88.1 /100 | #125 | Excellent 10.9% |
| Immigrants | Trinidad and Tobago | 86.9 /100 | #126 | Excellent 10.9% |
| Immigrants | Ukraine | 86.8 /100 | #127 | Excellent 10.9% |
| Immigrants | Latvia | 85.5 /100 | #128 | Excellent 10.9% |
| Immigrants | Philippines | 85.4 /100 | #129 | Excellent 10.9% |
| Brazilians | 85.4 /100 | #130 | Excellent 10.9% |
| Macedonians | 84.2 /100 | #131 | Excellent 11.0% |
| Immigrants | Fiji | 84.0 /100 | #132 | Excellent 11.0% |
| Ugandans | 83.9 /100 | #133 | Excellent 11.0% |
| Bhutanese | 83.4 /100 | #134 | Excellent 11.0% |
| Trinidadians and Tobagonians | 83.3 /100 | #135 | Excellent 11.0% |
| Immigrants | Costa Rica | 82.8 /100 | #136 | Excellent 11.0% |
| Immigrants | Europe | 82.0 /100 | #137 | Excellent 11.0% |
| Nigerians | 81.9 /100 | #138 | Excellent 11.0% |
| South Africans | 81.7 /100 | #139 | Excellent 11.0% |