Chickasaw vs Immigrants from El Salvador Male Disability
COMPARE
Chickasaw
Immigrants from El Salvador
Male Disability
Male Disability Comparison
Chickasaw
Immigrants from El Salvador
15.1%
MALE DISABILITY
0.0/ 100
METRIC RATING
339th/ 347
METRIC RANK
10.3%
MALE DISABILITY
99.7/ 100
METRIC RATING
44th/ 347
METRIC RANK
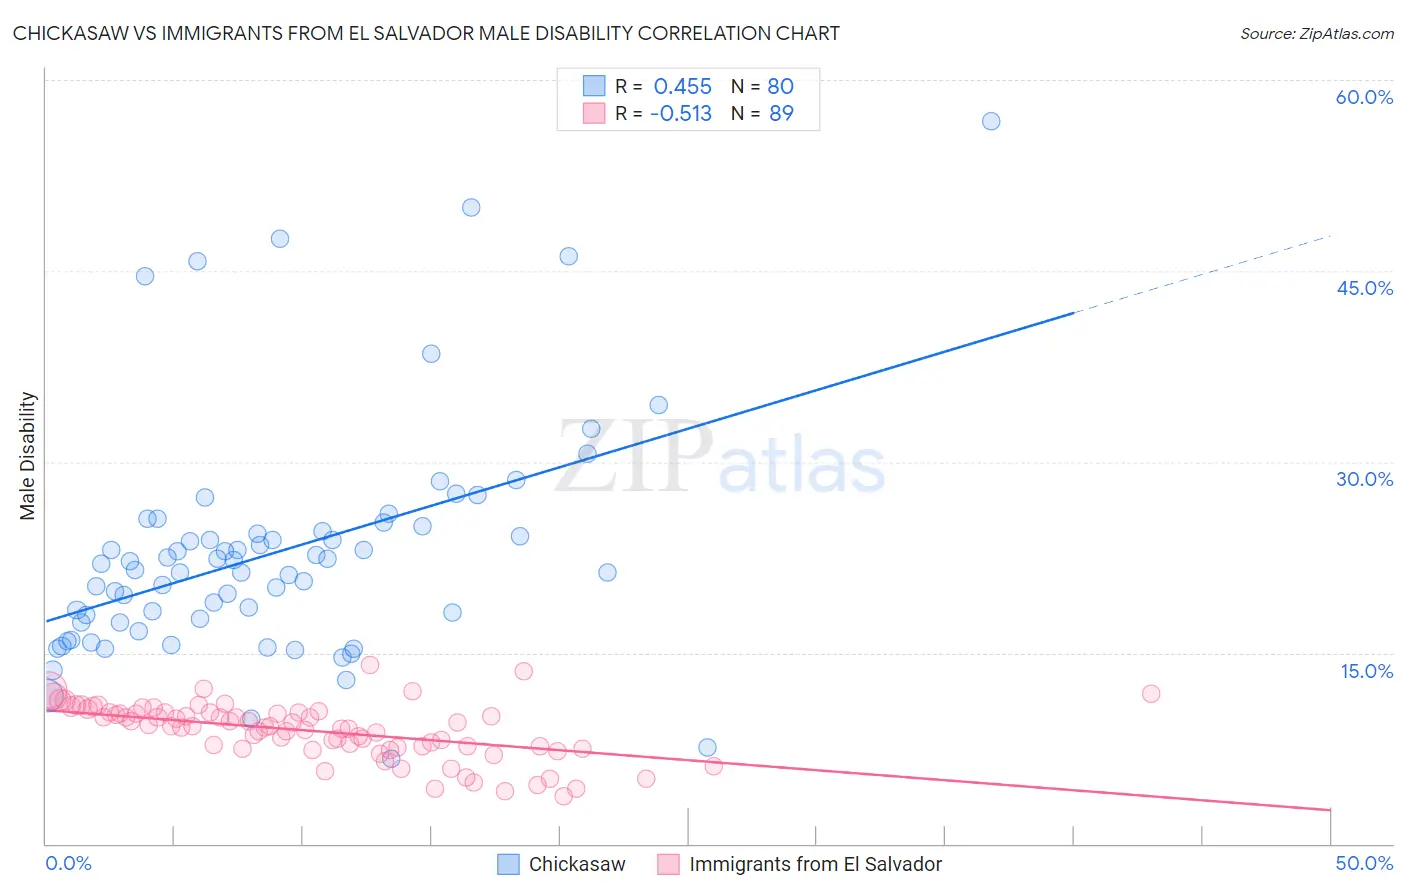
Chickasaw vs Immigrants from El Salvador Male Disability Correlation Chart
The statistical analysis conducted on geographies consisting of 147,685,248 people shows a moderate positive correlation between the proportion of Chickasaw and percentage of males with a disability in the United States with a correlation coefficient (R) of 0.455 and weighted average of 15.1%. Similarly, the statistical analysis conducted on geographies consisting of 357,750,884 people shows a substantial negative correlation between the proportion of Immigrants from El Salvador and percentage of males with a disability in the United States with a correlation coefficient (R) of -0.513 and weighted average of 10.3%, a difference of 46.7%.
Male Disability Correlation Summary
| Measurement | Chickasaw | Immigrants from El Salvador |
| Minimum | 6.7% | 3.7% |
| Maximum | 56.8% | 14.1% |
| Range | 50.1% | 10.4% |
| Mean | 22.9% | 8.9% |
| Median | 21.7% | 9.2% |
| Interquartile 25% (IQ1) | 17.4% | 7.6% |
| Interquartile 75% (IQ3) | 24.7% | 10.3% |
| Interquartile Range (IQR) | 7.4% | 2.7% |
| Standard Deviation (Sample) | 9.2% | 2.2% |
| Standard Deviation (Population) | 9.1% | 2.2% |
Similar Demographics by Male Disability
Demographics Similar to Chickasaw by Male Disability
In terms of male disability, the demographic groups most similar to Chickasaw are Lumbee (15.2%, a difference of 0.74%), Pueblo (15.0%, a difference of 0.80%), Menominee (15.0%, a difference of 0.91%), Alaskan Athabascan (14.9%, a difference of 1.4%), and Choctaw (15.4%, a difference of 1.8%).
| Demographics | Rating | Rank | Male Disability |
| Seminole | 0.0 /100 | #332 | Tragic 14.7% |
| Yuman | 0.0 /100 | #333 | Tragic 14.7% |
| Cherokee | 0.0 /100 | #334 | Tragic 14.8% |
| Dutch West Indians | 0.0 /100 | #335 | Tragic 14.8% |
| Alaskan Athabascans | 0.0 /100 | #336 | Tragic 14.9% |
| Menominee | 0.0 /100 | #337 | Tragic 15.0% |
| Pueblo | 0.0 /100 | #338 | Tragic 15.0% |
| Chickasaw | 0.0 /100 | #339 | Tragic 15.1% |
| Lumbee | 0.0 /100 | #340 | Tragic 15.2% |
| Choctaw | 0.0 /100 | #341 | Tragic 15.4% |
| Kiowa | 0.0 /100 | #342 | Tragic 15.4% |
| Creek | 0.0 /100 | #343 | Tragic 15.5% |
| Puerto Ricans | 0.0 /100 | #344 | Tragic 15.6% |
| Tsimshian | 0.0 /100 | #345 | Tragic 15.6% |
| Colville | 0.0 /100 | #346 | Tragic 16.5% |
Demographics Similar to Immigrants from El Salvador by Male Disability
In terms of male disability, the demographic groups most similar to Immigrants from El Salvador are Turkish (10.3%, a difference of 0.0%), Immigrants from Bangladesh (10.3%, a difference of 0.070%), Mongolian (10.3%, a difference of 0.090%), Cambodian (10.3%, a difference of 0.090%), and Immigrants from Peru (10.3%, a difference of 0.12%).
| Demographics | Rating | Rank | Male Disability |
| Immigrants | Indonesia | 99.8 /100 | #37 | Exceptional 10.2% |
| Immigrants | Kuwait | 99.8 /100 | #38 | Exceptional 10.2% |
| Afghans | 99.8 /100 | #39 | Exceptional 10.2% |
| Immigrants | Nepal | 99.8 /100 | #40 | Exceptional 10.3% |
| Taiwanese | 99.8 /100 | #41 | Exceptional 10.3% |
| Mongolians | 99.7 /100 | #42 | Exceptional 10.3% |
| Immigrants | Bangladesh | 99.7 /100 | #43 | Exceptional 10.3% |
| Immigrants | El Salvador | 99.7 /100 | #44 | Exceptional 10.3% |
| Turks | 99.7 /100 | #45 | Exceptional 10.3% |
| Cambodians | 99.7 /100 | #46 | Exceptional 10.3% |
| Immigrants | Peru | 99.7 /100 | #47 | Exceptional 10.3% |
| Israelis | 99.7 /100 | #48 | Exceptional 10.3% |
| Immigrants | Spain | 99.7 /100 | #49 | Exceptional 10.3% |
| South Americans | 99.6 /100 | #50 | Exceptional 10.3% |
| Salvadorans | 99.6 /100 | #51 | Exceptional 10.4% |