Chickasaw vs Immigrants from Chile Male Disability
COMPARE
Chickasaw
Immigrants from Chile
Male Disability
Male Disability Comparison
Chickasaw
Immigrants from Chile
15.1%
MALE DISABILITY
0.0/ 100
METRIC RATING
339th/ 347
METRIC RANK
10.6%
MALE DISABILITY
98.3/ 100
METRIC RATING
81st/ 347
METRIC RANK
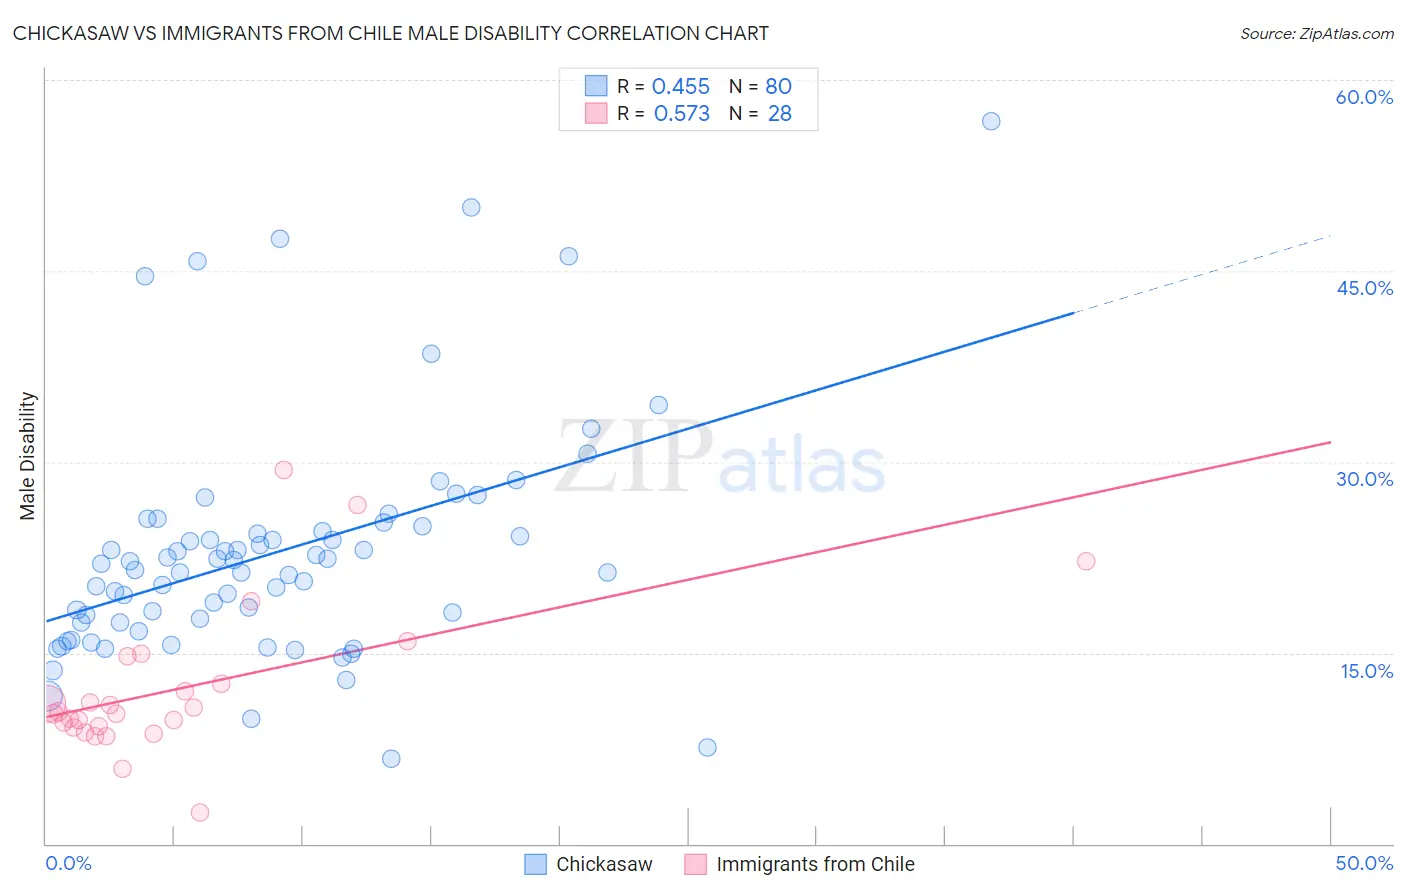
Chickasaw vs Immigrants from Chile Male Disability Correlation Chart
The statistical analysis conducted on geographies consisting of 147,685,248 people shows a moderate positive correlation between the proportion of Chickasaw and percentage of males with a disability in the United States with a correlation coefficient (R) of 0.455 and weighted average of 15.1%. Similarly, the statistical analysis conducted on geographies consisting of 218,637,346 people shows a substantial positive correlation between the proportion of Immigrants from Chile and percentage of males with a disability in the United States with a correlation coefficient (R) of 0.573 and weighted average of 10.6%, a difference of 42.8%.
Male Disability Correlation Summary
| Measurement | Chickasaw | Immigrants from Chile |
| Minimum | 6.7% | 2.4% |
| Maximum | 56.8% | 29.3% |
| Range | 50.1% | 26.9% |
| Mean | 22.9% | 12.2% |
| Median | 21.7% | 10.3% |
| Interquartile 25% (IQ1) | 17.4% | 9.2% |
| Interquartile 75% (IQ3) | 24.7% | 13.6% |
| Interquartile Range (IQR) | 7.4% | 4.4% |
| Standard Deviation (Sample) | 9.2% | 5.8% |
| Standard Deviation (Population) | 9.1% | 5.7% |
Similar Demographics by Male Disability
Demographics Similar to Chickasaw by Male Disability
In terms of male disability, the demographic groups most similar to Chickasaw are Lumbee (15.2%, a difference of 0.74%), Pueblo (15.0%, a difference of 0.80%), Menominee (15.0%, a difference of 0.91%), Alaskan Athabascan (14.9%, a difference of 1.4%), and Choctaw (15.4%, a difference of 1.8%).
| Demographics | Rating | Rank | Male Disability |
| Seminole | 0.0 /100 | #332 | Tragic 14.7% |
| Yuman | 0.0 /100 | #333 | Tragic 14.7% |
| Cherokee | 0.0 /100 | #334 | Tragic 14.8% |
| Dutch West Indians | 0.0 /100 | #335 | Tragic 14.8% |
| Alaskan Athabascans | 0.0 /100 | #336 | Tragic 14.9% |
| Menominee | 0.0 /100 | #337 | Tragic 15.0% |
| Pueblo | 0.0 /100 | #338 | Tragic 15.0% |
| Chickasaw | 0.0 /100 | #339 | Tragic 15.1% |
| Lumbee | 0.0 /100 | #340 | Tragic 15.2% |
| Choctaw | 0.0 /100 | #341 | Tragic 15.4% |
| Kiowa | 0.0 /100 | #342 | Tragic 15.4% |
| Creek | 0.0 /100 | #343 | Tragic 15.5% |
| Puerto Ricans | 0.0 /100 | #344 | Tragic 15.6% |
| Tsimshian | 0.0 /100 | #345 | Tragic 15.6% |
| Colville | 0.0 /100 | #346 | Tragic 16.5% |
Demographics Similar to Immigrants from Chile by Male Disability
In terms of male disability, the demographic groups most similar to Immigrants from Chile are Immigrants from Jordan (10.6%, a difference of 0.060%), Immigrants from Guyana (10.6%, a difference of 0.070%), Zimbabwean (10.6%, a difference of 0.080%), Immigrants from Poland (10.6%, a difference of 0.13%), and Bulgarian (10.6%, a difference of 0.14%).
| Demographics | Rating | Rank | Male Disability |
| Immigrants | Lebanon | 98.8 /100 | #74 | Exceptional 10.5% |
| Sierra Leoneans | 98.7 /100 | #75 | Exceptional 10.5% |
| Immigrants | Sierra Leone | 98.7 /100 | #76 | Exceptional 10.5% |
| Laotians | 98.6 /100 | #77 | Exceptional 10.6% |
| Immigrants | Russia | 98.6 /100 | #78 | Exceptional 10.6% |
| Zimbabweans | 98.4 /100 | #79 | Exceptional 10.6% |
| Immigrants | Jordan | 98.4 /100 | #80 | Exceptional 10.6% |
| Immigrants | Chile | 98.3 /100 | #81 | Exceptional 10.6% |
| Immigrants | Guyana | 98.2 /100 | #82 | Exceptional 10.6% |
| Immigrants | Poland | 98.1 /100 | #83 | Exceptional 10.6% |
| Bulgarians | 98.1 /100 | #84 | Exceptional 10.6% |
| Sri Lankans | 97.9 /100 | #85 | Exceptional 10.6% |
| Immigrants | Ireland | 97.9 /100 | #86 | Exceptional 10.6% |
| Immigrants | Vietnam | 97.9 /100 | #87 | Exceptional 10.6% |
| Immigrants | Western Asia | 97.8 /100 | #88 | Exceptional 10.6% |