Immigrants from Belize vs Brazilian Cognitive Disability
COMPARE
Immigrants from Belize
Brazilian
Cognitive Disability
Cognitive Disability Comparison
Immigrants from Belize
Brazilians
17.9%
COGNITIVE DISABILITY
0.5/ 100
METRIC RATING
260th/ 347
METRIC RANK
17.1%
COGNITIVE DISABILITY
78.9/ 100
METRIC RATING
155th/ 347
METRIC RANK
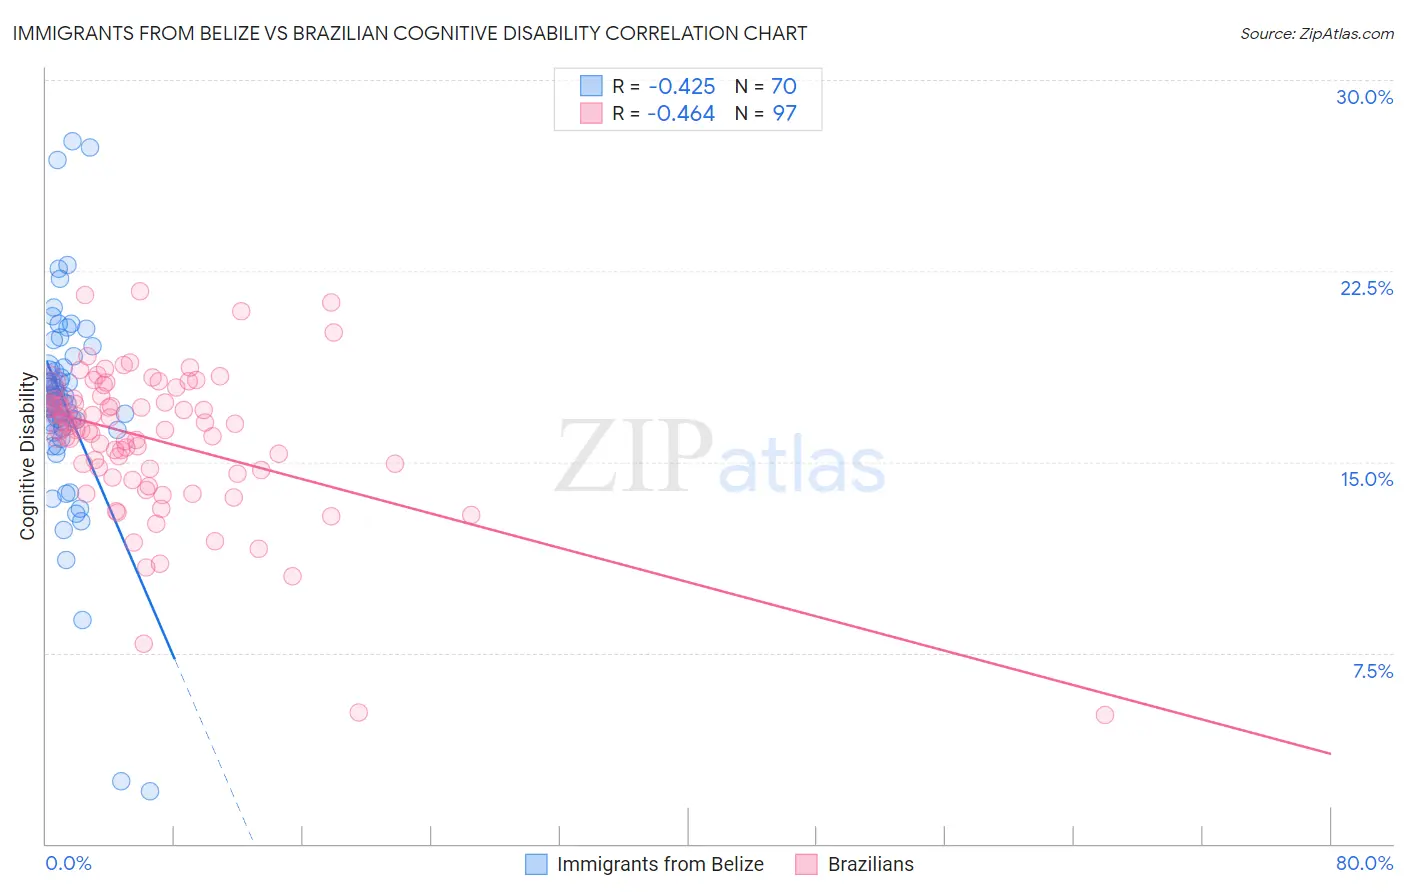
Immigrants from Belize vs Brazilian Cognitive Disability Correlation Chart
The statistical analysis conducted on geographies consisting of 130,294,835 people shows a moderate negative correlation between the proportion of Immigrants from Belize and percentage of population with cognitive disability in the United States with a correlation coefficient (R) of -0.425 and weighted average of 17.9%. Similarly, the statistical analysis conducted on geographies consisting of 323,952,153 people shows a moderate negative correlation between the proportion of Brazilians and percentage of population with cognitive disability in the United States with a correlation coefficient (R) of -0.464 and weighted average of 17.1%, a difference of 4.8%.
Cognitive Disability Correlation Summary
| Measurement | Immigrants from Belize | Brazilian |
| Minimum | 2.1% | 5.1% |
| Maximum | 27.6% | 21.7% |
| Range | 25.5% | 16.6% |
| Mean | 17.3% | 15.9% |
| Median | 17.3% | 16.3% |
| Interquartile 25% (IQ1) | 16.3% | 14.6% |
| Interquartile 75% (IQ3) | 18.7% | 17.5% |
| Interquartile Range (IQR) | 2.4% | 2.9% |
| Standard Deviation (Sample) | 4.1% | 2.9% |
| Standard Deviation (Population) | 4.1% | 2.9% |
Similar Demographics by Cognitive Disability
Demographics Similar to Immigrants from Belize by Cognitive Disability
In terms of cognitive disability, the demographic groups most similar to Immigrants from Belize are Ethiopian (17.9%, a difference of 0.010%), Guamanian/Chamorro (17.9%, a difference of 0.050%), Sierra Leonean (17.9%, a difference of 0.080%), Immigrants from Armenia (17.9%, a difference of 0.090%), and Mexican American Indian (17.9%, a difference of 0.10%).
| Demographics | Rating | Rank | Cognitive Disability |
| Hopi | 0.6 /100 | #253 | Tragic 17.9% |
| Hispanics or Latinos | 0.6 /100 | #254 | Tragic 17.9% |
| Immigrants | Azores | 0.6 /100 | #255 | Tragic 17.9% |
| Bahamians | 0.6 /100 | #256 | Tragic 17.9% |
| Mexican American Indians | 0.6 /100 | #257 | Tragic 17.9% |
| Immigrants | Armenia | 0.6 /100 | #258 | Tragic 17.9% |
| Ethiopians | 0.5 /100 | #259 | Tragic 17.9% |
| Immigrants | Belize | 0.5 /100 | #260 | Tragic 17.9% |
| Guamanians/Chamorros | 0.5 /100 | #261 | Tragic 17.9% |
| Sierra Leoneans | 0.4 /100 | #262 | Tragic 17.9% |
| Immigrants | Barbados | 0.4 /100 | #263 | Tragic 17.9% |
| Menominee | 0.4 /100 | #264 | Tragic 18.0% |
| Spanish Americans | 0.4 /100 | #265 | Tragic 18.0% |
| Belizeans | 0.4 /100 | #266 | Tragic 18.0% |
| Nepalese | 0.3 /100 | #267 | Tragic 18.0% |
Demographics Similar to Brazilians by Cognitive Disability
In terms of cognitive disability, the demographic groups most similar to Brazilians are Sri Lankan (17.1%, a difference of 0.0%), Immigrants from Malaysia (17.1%, a difference of 0.020%), Immigrants from Kazakhstan (17.1%, a difference of 0.070%), Immigrants from Australia (17.1%, a difference of 0.12%), and Immigrants from Indonesia (17.1%, a difference of 0.17%).
| Demographics | Rating | Rank | Cognitive Disability |
| French Canadians | 85.7 /100 | #148 | Excellent 17.1% |
| Cypriots | 85.7 /100 | #149 | Excellent 17.1% |
| Basques | 85.5 /100 | #150 | Excellent 17.1% |
| Syrians | 83.0 /100 | #151 | Excellent 17.1% |
| Immigrants | Indonesia | 82.7 /100 | #152 | Excellent 17.1% |
| Immigrants | Kazakhstan | 80.5 /100 | #153 | Excellent 17.1% |
| Immigrants | Malaysia | 79.3 /100 | #154 | Good 17.1% |
| Brazilians | 78.9 /100 | #155 | Good 17.1% |
| Sri Lankans | 78.9 /100 | #156 | Good 17.1% |
| Immigrants | Australia | 76.0 /100 | #157 | Good 17.1% |
| Celtics | 74.1 /100 | #158 | Good 17.1% |
| Immigrants | Latvia | 73.2 /100 | #159 | Good 17.2% |
| Australians | 72.4 /100 | #160 | Good 17.2% |
| Americans | 72.2 /100 | #161 | Good 17.2% |
| Yugoslavians | 71.6 /100 | #162 | Good 17.2% |